

Top Cultural Facility Architecture Firms
| Rank | Company | 2012 Cultural Facility Revenue ($) |
| 1 | Gensler | $67,600,000 |
| 2 | Cambridge Seven Associates | $18,547,000 |
| 3 | Morris Architects | $10,420,000 |
| 4 | Ennead Architects | $8,930,000 |
| 5 | Hammel, Green and Abrahamson | $8,577,000 |
| 6 | Beyer Blinder Belle Architects & Planners | $8,384,500 |
| 7 | Westlake Reed Leskosky | $8,000,000 |
| 8 | SmithGroupJJR | $7,000,000 |
| 9 | Stantec | $6,997,086 |
| 10 | EwingCole | $6,000,000 |
| 11 | HOK | $4,435,000 |
| 12 | H3 Hardy Collaboration Architecture | $4,404,000 |
| 13 | SRG Partnership | $3,357,406 |
| 14 | Davis Brody Bond | $3,182,464 |
| 15 | Heery International | $3,119,572 |
| 16 | Payette | $2,922,257 |
| 17 | LS3P | $2,713,713 |
| 18 | LMN Architects | $2,335,000 |
| 19 | RTKL Associates | $2,177,000 |
| 20 | GBBN Architects | $2,100,000 |
| 21 | WATG / Wimberly Interiors | $2,013,000 |
| 22 | BBS Architects, Landscape Architects and Engineers | $1,950,000 |
| 23 | Mithun | $1,910,000 |
| 24 | Fentress Architects | $1,839,999 |
| 25 | OZ Architecture | $1,509,469 |
| 26 | Lord, Aeck & Sargent | $1,500,000 |
| 27 | Perkins Eastman | $1,450,000 |
| 28 | Skidmore, Owings & Merrill | $1,229,000 |
| 29 | IBI Group | $1,175,748 |
| 30 | Leo A Daly | $1,057,977 |
| 31 | Kirksey Architecture | $1,057,626 |
| 32 | DesignGroup | $1,022,301 |
| 33 | Wight & Co. | $894,700 |
| 34 | Harvard Jolly Architecture | $780,250 |
| 35 | CO Architects | $772,000 |
| 36 | ZGF Architects | $758,307 |
| 37 | VOA Associates | $544,020 |
| 38 | Shepley Bulfinch Richardson & Abbott | $536,426 |
| 39 | Good Fulton & Farrell | $482,504 |
| 40 | Harley Ellis Devereaux | $465,000 |
| 41 | Sasaki Associates | $446,968 |
| 42 | CTA Architects Engineers | $441,822 |
| 43 | SHW Group | $434,312 |
| 44 | Emersion Design | $422,506 |
| 45 | Goodwyn, Mills & Cawood | $380,000 |
| 46 | LPA | $365,223 |
| 47 | Kaplan McLaughlin Diaz | $324,616 |
| 48 | Ballinger | $305,000 |
| 49 | Moody Nolan | $260,000 |
| 50 | Fanning/Howey Associates | $250,000 |
| 51 | NBBJ | $240,000 |
| 52 | Margulies Perruzzi Architects | $232,295 |
| 53 | Hoffmann Architects | $215,000 |
| 54 | Astorino | $197,000 |
| 55 | Cooper Carry | $163,938 |
| 56 | Environetics | $158,000 |
| 57 | Perkowitz+Ruth Architects | $155,385 |
| 58 | NAC|Architecture | $135,041 |
| 59 | KZF Design | $129,962 |
| 60 | Little | $128,833 |
| 61 | Carrier Johnson + Culture | $113,208 |
| 62 | RSP Architects | $93,000 |
| 63 | Hoefer Wysocki Architecture | $67,000 |
| 64 | RDH Interests | $61,308 |
| 65 | Nadel | $50,000 |
| 66 | LARGE Architecture | $37,727 |
| 67 | TEG Architects - The Estopinal Group | $27,500 |
| 68 | Smallwood, Reynolds, Stewart, Stewart & Associates | $20,510 |
| 69 | Corgan | $20,332 |
| 70 | FXFOWLE Architects | $18,947 |
| 71 | Kohn Pedersen Fox Associates | $17,600 |
| 72 | Epstein | $13,500 |
| 73 | DLA Architects | $2,400 |
Top Cultural Facility Engineering Firms
| Rank | Company | 2012 Cultural Facility Revenue ($) |
| 1 | Buro Happold Consulting Engineers | $16,754,000 |
| 2 | Arup | $14,035,257 |
| 3 | Parsons Brinckerhoff | $8,100,000 |
| 4 | URS Corp. | $7,617,256 |
| 5 | Simpson Gumpertz & Heger | $6,400,000 |
| 6 | Thornton Tomasetti | $5,341,390 |
| 7 | Dewberry | $4,209,683 |
| 8 | Wiss, Janney, Elstner Associates | $3,800,000 |
| 9 | WSP USA | $3,788,066 |
| 10 | TLC Engineering for Architecture | $1,962,920 |
| 11 | AKF Group | $1,952,000 |
| 12 | Vanderweil Engineers | $1,725,200 |
| 13 | Magnusson Klemencic Associates | $1,666,546 |
| 14 | Aon Fire Protection Engineering | $1,500,000 |
| 15 | Heapy Engineering | $1,426,292 |
| 16 | Jacobs Engineering Group | $1,380,000 |
| 17 | Joseph R. Loring & Associates | $1,300,000 |
| 18 | Henderson Engineers | $1,253,547 |
| 19 | Glumac | $1,199,000 |
| 20 | Walter P Moore | $1,133,614 |
| 21 | Karpinski Engineering | $1,103,496 |
| 22 | KLH Engineers | $1,042,000 |
| 23 | Affiliated Engineers | $1,013,000 |
| 24 | KJWW Engineering Consultants | $907,135 |
| 25 | Syska Hennessy Group | $880,773 |
| 26 | TTG | $850,500 |
| 27 | Rolf Jensen & Associates | $800,000 |
| 28 | Environmental Systems Design | $718,209 |
| 29 | Sparling | $666,643 |
| 30 | H&A Architects & Engineers | $643,665 |
| 31 | Degenkolb Engineers | $620,352 |
| 32 | M-E Engineers | $600,000 |
| 33 | Paulus, Sokolowski and Sartor | $500,000 |
| 34 | Spectrum Engineers | $472,639 |
| 35 | Walker Parking Consultants | $418,380 |
| 36 | Newcomb & Boyd | $414,970 |
| 37 | GRAEF | $401,485 |
| 38 | French & Parrello Associates | $400,000 |
| 39 | RMF Engineering Design | $350,000 |
| 40 | Peter Basso Associates | $300,000 |
| 41 | Interface Engineering | $286,000 |
| 42 | Wallace Engineering | $220,000 |
| 43 | Davis, Bowen & Friedel | $215,069 |
| 44 | Clark Nexsen | $203,502 |
| 45 | OLA Consulting Engineers | $200,000 |
| 46 | Brinjac Engineering | $176,279 |
| 47 | Smith Seckman Reid | $173,660 |
| 48 | Bridgers & Paxton Consulting Engineers | $168,689 |
| 49 | Eaton Energy Solutions | $164,622 |
| 50 | Haynes Whaley Associates | $135,310 |
| 51 | CJL Engineering | $129,929 |
| 52 | Bard, Rao + Athanas Consulting Engineers | $100,000 |
| 52 | CTLGroup | $100,000 |
| 52 | Dunham Associates | $100,000 |
| 52 | ThermalTech Engineering | $100,000 |
| 56 | Wick Fisher White | $73,143 |
| 57 | Science Applications International Corp. | $57,222 |
| 58 | Primera Engineers | $50,000 |
| 59 | SSOE Group | $44,613 |
| 60 | Allen & Shariff | $25,000 |
| 61 | Total Building Commissioning | $20,361 |
| 62 | FBA Engineering | $15,000 |
| 63 | G&W Engineering | $11,800 |
| 64 | Kamm Consulting | $7,750 |
Top Cultural Facility Construction Firms
| Rank | Company | 2012 Cultural Facility Revenue ($) |
| 1 | Turner Corporation, The | $322,870,000 |
| 2 | Austin Commercial | $227,421,855 |
| 3 | PCL Construction Enterprises | $220,972,861 |
| 4 | Whiting-Turner Contracting Co., The | $190,148,911 |
| 5 | Tutor Perini Corporation | $124,433,008 |
| 6 | Structure Tone | $112,249,000 |
| 7 | Balfour Beatty | $83,254,501 |
| 8 | Pepper Construction Group | $79,907,000 |
| 9 | Flintco | $79,300,000 |
| 10 | C.W. Driver | $66,471,002 |
| 11 | Clark Group | $61,287,659 |
| 12 | Gilbane | $57,812,000 |
| 13 | Hoar Construction | $48,799,000 |
| 14 | JE Dunn Construction | $45,477,917 |
| 15 | Suffolk Construction | $43,630,962 |
| 16 | O'Neil Industries/W.E. O'Neil | $40,054,169 |
| 17 | Holder Construction | $39,000,000 |
| 18 | Hunt Construction Group | $38,000,000 |
| 19 | Barton Malow | $36,488,798 |
| 20 | Linbeck Group | $31,000,000 |
| 20 | McCarthy Holdings | $31,000,000 |
| 22 | McGough | $24,200,000 |
| 23 | E.W. Howell | $23,901,000 |
| 24 | Paric | $20,000,000 |
| 25 | James G Davis Construction | $19,200,000 |
| 26 | Messer Construction | $18,815,277 |
| 27 | Bernards | $18,700,000 |
| 28 | Shawmut Design and Construction | $15,900,000 |
| 29 | Boldt Company, The | $15,653,090 |
| 30 | Skanska USA | $15,381,184 |
| 31 | Graycor | $13,971,418 |
| 32 | Clancy & Theys Construction | $12,000,000 |
| 33 | Yates Cos., The | $10,100,000 |
| 34 | Choate Construction | $9,104,074 |
| 35 | Bette Companies, The | $8,000,000 |
| 36 | Rodgers Builders | $6,288,000 |
| 37 | Weitz Co., The | $5,313,127 |
| 38 | Brasfield & Gorrie | $4,874,763 |
| 39 | Gray | $4,700,000 |
| 40 | Walsh Group, The | $3,695,725 |
| 41 | Lend Lease | $3,490,000 |
| 42 | HITT Contracting | $2,627,748 |
| 43 | DPR Construction | $2,615,528 |
| 44 | CORE Construction Group | $2,408,763 |
| 45 | Coakley & Williams Construction | $2,262,406 |
| 46 | Stalco Construction | $2,000,000 |
| 47 | Hoffman Construction | $1,000,000 |
| 48 | ECC | $863,732 |
| 49 | KBE Building Corporation | $851,409 |
| 50 | W. M. Jordan Co. | $847,630 |
| 51 | Jones Lang LaSalle | $750,000 |
| 52 | James McHugh Construction | $256,905 |
| 53 | Kitchell | $250,000 |
| 54 | Alberici Constructors | $31,589 |
Read the full 2013 Giants 300 Report
Related Stories
| Jan 7, 2011
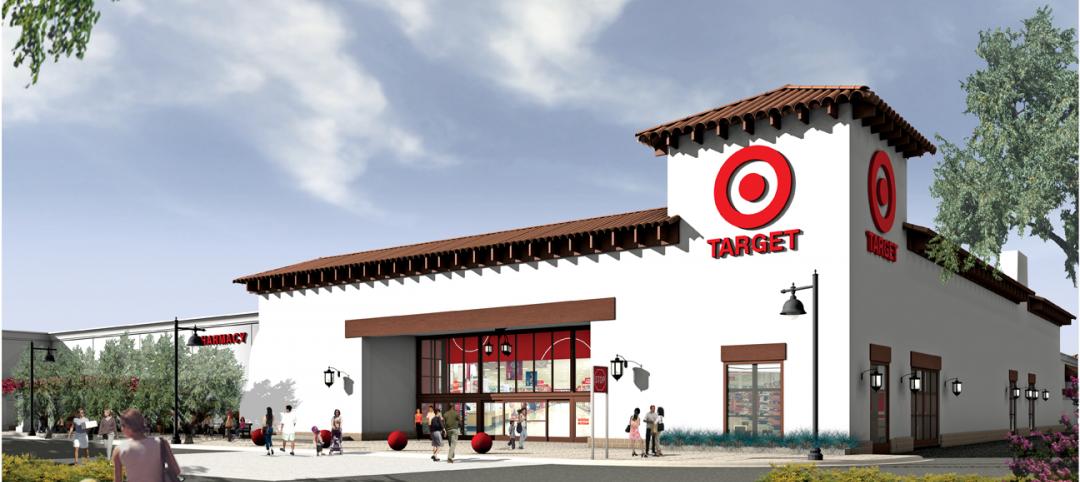
BIM on Target
By using BIM for the design of its new San Clemente, Calif., store, big-box retailer Target has been able to model the entire structural steel package, including joists, in 3D, chopping the timeline for shop drawings from as much as 10 weeks down to an ‘unheard of’ three-and-a-half weeks.
| Jan 7, 2011
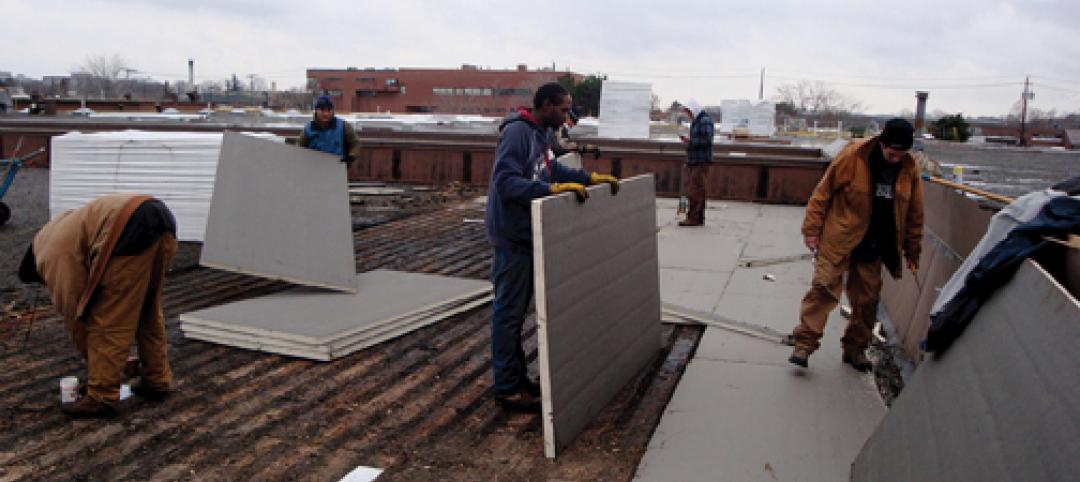
How Building Teams Choose Roofing Systems
A roofing survey emailed to a representative sample of BD+C’s subscriber list revealed such key findings as: Respondents named metal (56%) and EPDM (50%) as the roofing systems they (or their firms) employed most in projects. Also, new construction and retrofits were fairly evenly split among respondents’ roofing-related projects over the last couple of years.
| Jan 7, 2011
Total construction to rise 5.1% in 2011
Total U.S. construction spending will increase 5.1% in 2011. The gain from the end of 2010 to the end of 2011 will be 10%. The biggest annual gain in 2011 will be 10% for new residential construction, far above the 2-3% gains in all other construction sectors.
| Jan 7, 2011
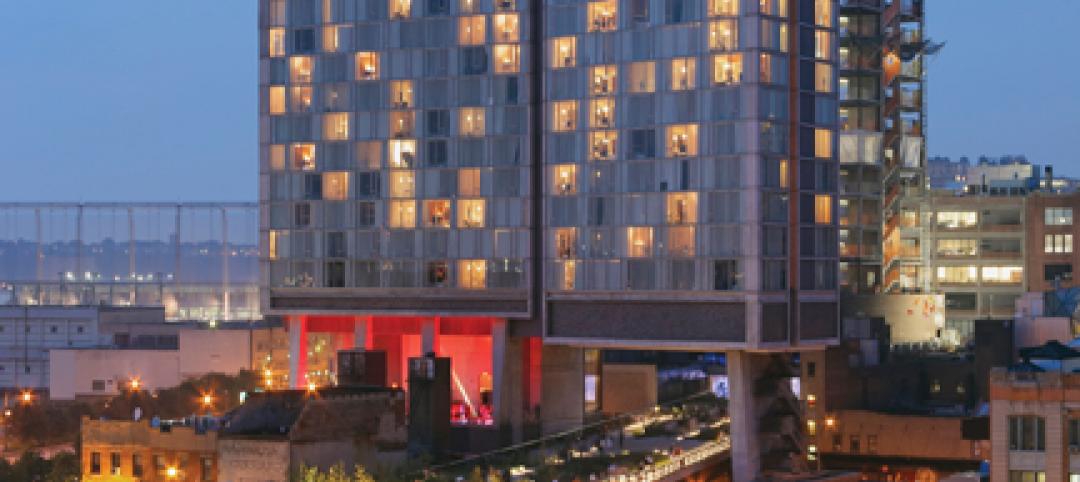
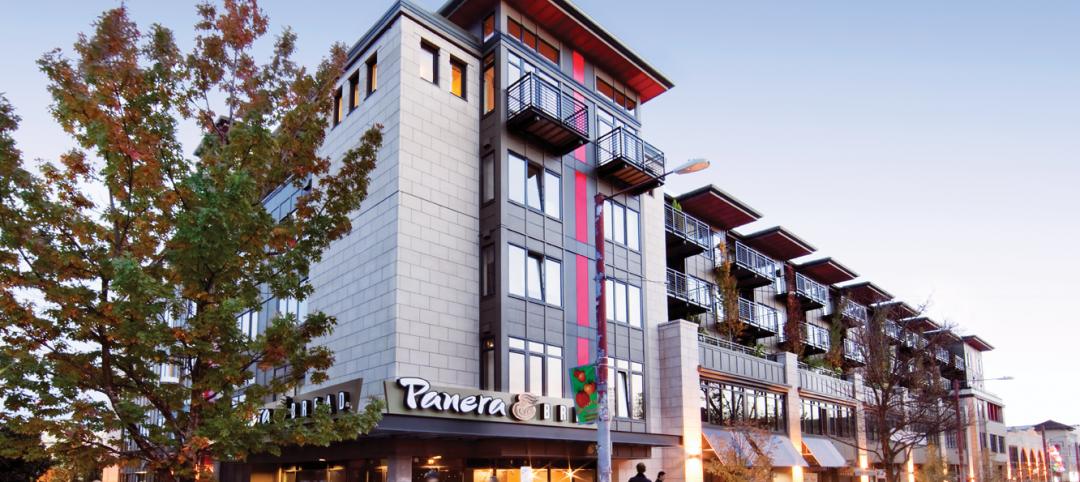
Mixed-Use on Steroids
Mixed-use development has been one of the few bright spots in real estate in the last few years. Successful mixed-use projects are almost always located in dense urban or suburban areas, usually close to public transportation. It’s a sign of the times that the residential component tends to be rental rather than for-sale.
| Jan 4, 2011
Product of the Week: Zinc cladding helps border crossing blend in with surroundings
Zinc panels provide natural-looking, durable cladding for an administrative building and toll canopies at the newly expanded Queenstown Plaza U.S.-Canada border crossing at the Niagara Gorge. Toronto’s Moriyama & Teshima Architects chose the zinc alloy panels for their ability to blend with the structures’ scenic surroundings, as well as for their low maintenance and sustainable qualities. The structures incorporate 14,000 sf of Rheinzink’s branded Angled Standing Seam and Reveal Panels in graphite gray.
| Jan 4, 2011
6 green building trends to watch in 2011
According to a report by New York-based JWT Intelligence, there are six key green building trends to watch in 2011, including: 3D printing, biomimicry, and more transparent and accurate green claims.
| Jan 4, 2011
LEED standards under fire in NYC
This year, for the first time, owners of 25,000 commercial properties in New York must report their buildings’ energy use to the city. However, LEED doesn’t measure energy use and costs, something a growing number of engineers, architects, and landlords insist must be done. Their concerns and a general blossoming of environmental awareness have spawned a host of rating systems that could test LEED’s dominance.
| Jan 4, 2011
LEED 2012: 10 changes you should know about
The USGBC is beginning its review and planning for the next version of LEED—LEED 2012. The draft version of LEED 2012 is currently in the first of at least two public comment periods, and it’s important to take a look at proposed changes to see the direction USGBC is taking, the plans they have for LEED, and—most importantly—how they affect you.
| Jan 4, 2011
California buildings: now even more efficient
New buildings in California must now be more sustainable under the state’s Green Building Standards Code, which took effect with the new year. CALGreen, the first statewide green building code in the country, requires new buildings to be more energy efficient, use less water, and emit fewer pollutants, among many other requirements. And they have the potential to affect LEED ratings.


