


A new report on office fit-out costs in North America sets out to establish a range of benchmarks for three different office styles, and to suggest what businesses favor which style.
JLL’s project and development services group, which produced the report, used data from more than 2,800 JLL-managed project budgets for over 100 clients from 17 industries in 59 markets throughout the U.S. and Canada.
The goal, says JLL, is to “elevate the conversation” around the real costs of building out various real estate designs. This year’s report includes office layout and space quality components to allow for evaluations of different office layouts, project complexities, and materials. It also provides high, medium, and low allowances for furniture, fixtures, and equipment (FFE); as well as for the installation of audio-visual and security equipment.
The result is an Office Fit Out Matrix, which shows how a handful of dynamics affect fit-out costs. Depending on the market and style, the costs range from $120.18 per sf to $216.07 per sf (see chart).
JLL breaks down these costs by region and metro market. The Northeast and Northwest consistently have higher fit-out costs. The medium costs in New York City are 28.5% above the U.S. average. In San Francisco, a fit-out would cost 22.6% more than the U.S. average. Conversely, the medium fit-out costs in West Palm Beach, Fla., are 15.9% below the national average; in Austin, Texas, 15.3% below.

This office fit-out matrix is based on data from over 2,800 project budgets in North America that JLL managed. Image: JLL

JLL's matrix compares the medium costs for fitting out three different office styles. Image: JLL
Three office styles examined
JLL divides its office fit-out costs along three styles:
• A Traditional office is still the most expensive to fit out. This style has the highest percentage of private office spaces, and typically between 20% and 50% fewer employees than the other two styles. Its FFE costs are the highest among the three styles, too. And tenant factors are “relatively small,” says JLL, because there is less common area. These offices are still favored by law firms, financial services companies, and businesses that focus on privacy with their offices.
JLL observes that some Traditional office styles are introducing lower-partition bench desks.
• A less-expensive fit-out, a Moderate office style features “agile” floorplans, with 10% dedicated to enclosed offices, and the rest of the space open with 6x6-foot workstations and minimal benching and guest space. Moderate offices—which are 20-25% less dense than Progressive office styles—include a healthy mix of conference rooms, and a few multipurpose and collaborative spaces. The hard fit-out costs for the Moderate style are average, but cost efficiencies can be captured by adding more bench-style desks.
• The Progressive office style is distinguished by an open floorplan, 100% of its desk space outfitted as bench-style furniture with zero enclosed spaces. This style’s focus is on activity-based working. Its employee density is 20-50% higher than a Traditional office, and it has double the amount of collaborative and conference spaces. (A standard plan would include 20 conference rooms and seven open collaborative/multi-use spaces.)
JLL points out that Progressive fit-outs generally have higher technology costs, but save money on FFE spending.
Landlords allowing for more upgrades
Last year, nearly 69 million sf of new office space were delivered to the market, but only 47.4% was preleased. JLL’s report observes that landlords are spending more to compete for tenants that are consistently gravitating toward high-quality spaces and assets. Consequently, landlords are offering better tenant improvement packages.
JLL cites several reasons for this trend, including the steady climb in construction costs, which increased on average by 15% last year. Landlords also offer better tenant improvement packages to offset the impact of higher rents.
The national average for tenant improvement allowances was $44 per sf, ranging from $105/sf in Washington D.C. to $28/sf in Nashville.
The report provides detailed snapshots of several markets, such as Austin, one of the country’s dynamic office markets, with robust growth supply. There are 3.1 million sf of new office space in Austin’s pipeline, 36% of which is preleased. The average tenant improvement allowance there last year was $45/sf.
There’s 7 million sf of new office space in the pipeline in San Francisco, where the office vacancy rate is 9.1%, and 68.8% of new space is preleased. The average tenant improvement allowance in San Francisco last year was $60/sf.
Related Stories

Office Buildings | Oct 21, 2019
IH Mississippi Valley Credit Union headquarters completes construction
LEO A Daly designed the building.

Office Buildings | Oct 17, 2019
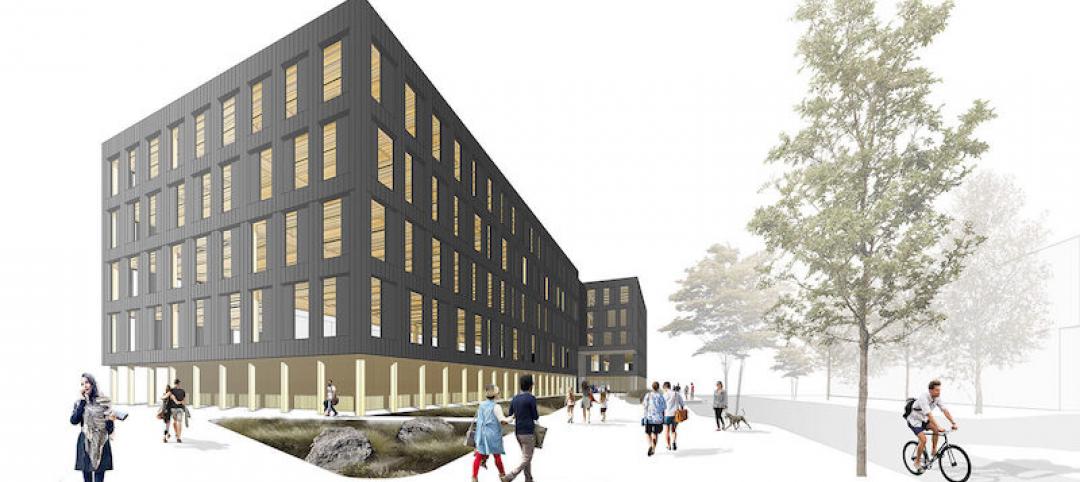
New social campus for innovators, tech leaders covers a full city block
Hollwich Kushner, with Gensler as design development architects, designed the building.

Office Buildings | Oct 15, 2019
New 80,000-sf coworking space completes in Chicago
It is the third ‘Spaces’ location in Chicago.

Office Buildings | Oct 8, 2019
David Chipperfield Architects to design new Rolex USA headquarters
The project will replace the existing building that has been occupied by Rolex since the 1970s.

Healthcare Facilities | Oct 1, 2019
Medical offices are filling space vacated by retail
Healthcare developers and providers like the locations, traffic, and parking these spaces offer.
Office Buildings | Sep 25, 2019
'Catalyst' will be Washington’s first CLT office building
Katerra is the design builder for the project with Michael Green Architecture as the design architect.

Office Buildings | Sep 6, 2019
New office complex in Southern California strives to create a Silicon Valley-like campus vibe
FLIGHT at Tustin Legacy includes 100,000 sf of amenities, and is laid out to tie into the surrounding city.
Office Buildings | Sep 3, 2019
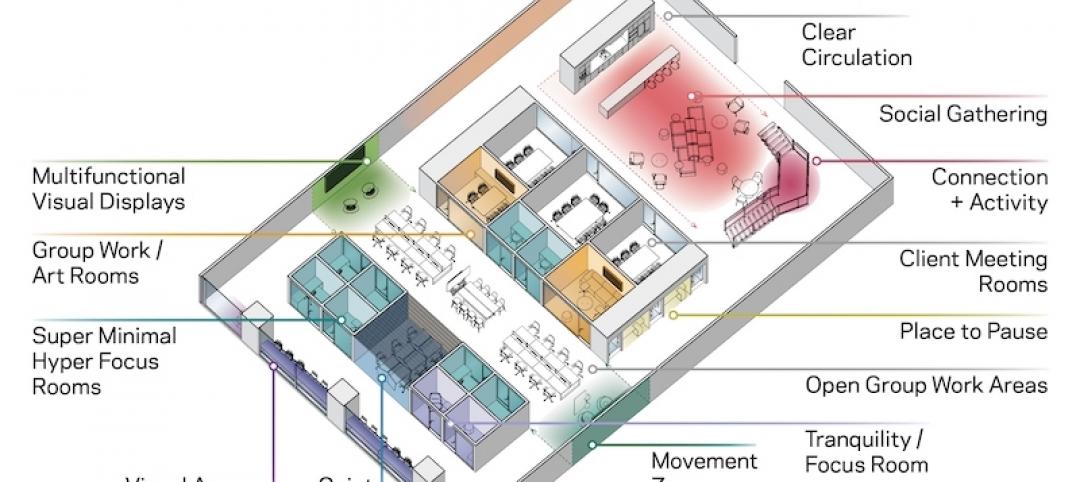
A new HOK report focuses on designing offices for a neurodiverse workforce
Emphasizing inclusion and choice is a key component.

Giants 400 | Aug 8, 2019
Top 110 Office Sector Construction Firms for 2019
Turner, STO Building Group, AECOM, Clayco, and Clark lead the rankings of the nation's largest office sector contractors and construction managers, as reported in Building Design+Construction's 2019 Giants 300 Report.

Giants 400 | Aug 8, 2019
Top 100 Office Sector Engineering Firms for 2019
Jacobs, Burns & McDonnell, WSP, Thornton Tomasetti, and Arup head the rankings of the nation's largest office sector engineering and engineering architecture (EA) firms, as reported in Building Design+Construction's 2019 Giants 300 Report.


