


In a recent survey, nearly 900 construction firms reported gains in profitability last year, especially among the top 25% whose financial performances significantly outpaced the respondents as a whole.
The Construction Financial Management Association (CFMA), headquartered in Princeton, N.J., emailed its annual questionnaire to about 8,000 member and nonmember construction firms, as well as member CPA firms that represent construction companies. CFMA received data from 869 companies, which submitted detailed financial statements and other required information.
Thirty-seven percent of the respondents were Industrial & Nonresidential contractors, 19% Heavy & Highway contractors, 43% Specialty Trade contractors, and less than 1% classified as “Other.” The typical company reported total annual sales of $39,710,000 for the 2015 fiscal year. Those with sales under $10 million comprised 16% of responding companies, and 8% of respondents reported sales of over $300 million.
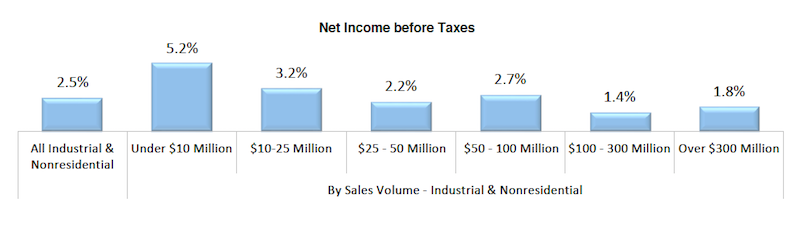
Smaller contracting companies showed stronger earnings last year. Chart: Construction Financial Management Association.
On average, the respondents’ returns on assets and equity rose last year. Returns on Assets was 9%, versus 6.9% in 2014. Returns on equity jumped to 25.3% in 2015, from 19% the previous year.
On the whole, getting paid for services rendered remains a struggle. The respondents’ invoices were in accounts receivable for an average of 55.2 days last year, an increase over the previous two years. As for their accounts payable, the contractors reported a decline to 33.4 days last year, from 35.6 days in 2014.
Gross profits as a percentage of revenue increased to 15%, from 13.1% in 2014. And net income last year stood a 4.4% of sales, versus 3.1% the previous year.
CFMA broke out the financial data by sales volume, and found that companies generating under $10 million in revenue generally had higher profitability ratios than other cohorts. Perhaps coincidentally, the smaller companies had lower debt-to-equity ratios, and significantly lower “underbillings-to-equity” ratios (4.4%, compared to 15.6% for companies with $300 million or more in annual revenue).
Conversely, the largest companies by revenue were more productive, reporting sales per employee of $751,348 ($276,000 more per employee than companies with between $100 million and $300 million in sales, and even higher compared to the other groups), and gross profit per employee of $71,851.
The top-performing contractors—based on a composite ranking of five performance metrics (ROA, ROE, debt to equity, fixed-asset ratios, and gross profit per employee)—were head and shoulders above respondent averages.
The highest achievers reported a 24% Return on Assets and 58.5% Return on Equity, substantively higher on both counts than the survey’s averages noted above.
Best in Class companies also reported less debt (1.2 times debt-to-equity versus 1.8 times for all respondents) and a more stable fixed asset ratio (16.6% versus 25.1% for all respondents). All respondents averaged a 15% gross profit margin, while the Best in Class companies achieved an 18.4% margin. Further, all respondents earned a 4.4% net income before taxes, compared with the highest achievers, which averaged 8.4% margin.
The CFMA survey was compiled and analyzed by Industry Insights and the organization’s Financial Survey & Benchmarker Committee. It did not provide explanations about why some contractors performed better than others.
Related Stories
 announced the appointment of Babette Freund to its Board of Directors.")
| Oct 25, 2011
Ritner Steel CEO elected to AISC Board
Freund will begin serving on the AISC board of directors, assisting with the organization's planning and leadership in the steel construction industry.

| Oct 25, 2011
Commitment to green building practices pays off
The study, conducted by the Pacific Northwest National Laboratory, built on a good indication of the potential for increased productivity and performance pilot research completed two years ago, with similarly impressive results.

| Oct 25, 2011
DOE issues report on financing solar photovoltaic systems for K-12 schools
The report examines the two primary types of ownership models used to obtain solar installations. This analysis can help school administrators across the country select the best option for deploying solar technologies in their school districts.

| Oct 25, 2011
MKK participates in BSA Engineering Merit Badge day
MKK principal Craig Watts attended the event as a representative of the MEP (mechanical/electrical/plumbing) engineering industry to give scouts an idea of what’s involved in becoming a mechanical engineer, and an overview of a typical day in the life of an engineer.

| Oct 24, 2011
BBS Architects & Engineers receives 2011 Sustainable Design Award from AIA Long Island Chapter
AIA LI also recognized BBS with the 2011 ARCHI Award Commendation for the St. Charles Resurrection Cemetery St. Charles Resurrection Cemetery Welcoming and Information Center in Farmingdale, NY.

| Oct 20, 2011
UNT receives nation’s first LEED Platinum designation for collegiate stadium
Apogee Stadium will achieve another first in December with the completion of three wind turbines that will feed the electrical grid that powers the stadium.

| Oct 20, 2011
Process leads to new design values for southern pine and other visually graded dimension lumber
A summary of the process used to develop new design values will clarify many of the questions received by the SFPA.

| Oct 20, 2011
Johnson Controls appoints Wojciechowski to lead real estate and facilities management business for Global Technology sector
Wojciechowski will be responsible for leading the continued growth of the technology vertical market, while building on the expertise the company has developed serving multinational technology companies.

| Oct 20, 2011
Stellar hires Navy veteran Taylor as vice president
Stellar’s federal experience includes military exchanges (large retail stores on military bases), lodging facilities for military personnel, fuel stations, youth activities centers and recreational centers.


