


In a recent survey, nearly 900 construction firms reported gains in profitability last year, especially among the top 25% whose financial performances significantly outpaced the respondents as a whole.
The Construction Financial Management Association (CFMA), headquartered in Princeton, N.J., emailed its annual questionnaire to about 8,000 member and nonmember construction firms, as well as member CPA firms that represent construction companies. CFMA received data from 869 companies, which submitted detailed financial statements and other required information.
Thirty-seven percent of the respondents were Industrial & Nonresidential contractors, 19% Heavy & Highway contractors, 43% Specialty Trade contractors, and less than 1% classified as “Other.” The typical company reported total annual sales of $39,710,000 for the 2015 fiscal year. Those with sales under $10 million comprised 16% of responding companies, and 8% of respondents reported sales of over $300 million.
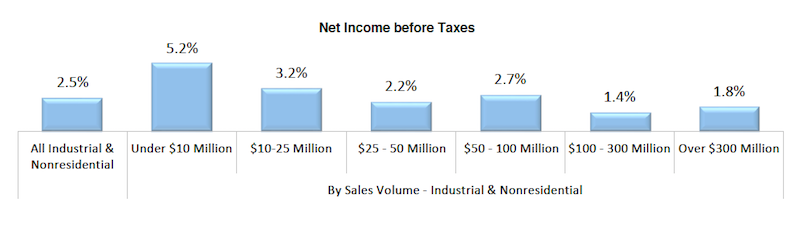
Smaller contracting companies showed stronger earnings last year. Chart: Construction Financial Management Association.
On average, the respondents’ returns on assets and equity rose last year. Returns on Assets was 9%, versus 6.9% in 2014. Returns on equity jumped to 25.3% in 2015, from 19% the previous year.
On the whole, getting paid for services rendered remains a struggle. The respondents’ invoices were in accounts receivable for an average of 55.2 days last year, an increase over the previous two years. As for their accounts payable, the contractors reported a decline to 33.4 days last year, from 35.6 days in 2014.
Gross profits as a percentage of revenue increased to 15%, from 13.1% in 2014. And net income last year stood a 4.4% of sales, versus 3.1% the previous year.
CFMA broke out the financial data by sales volume, and found that companies generating under $10 million in revenue generally had higher profitability ratios than other cohorts. Perhaps coincidentally, the smaller companies had lower debt-to-equity ratios, and significantly lower “underbillings-to-equity” ratios (4.4%, compared to 15.6% for companies with $300 million or more in annual revenue).
Conversely, the largest companies by revenue were more productive, reporting sales per employee of $751,348 ($276,000 more per employee than companies with between $100 million and $300 million in sales, and even higher compared to the other groups), and gross profit per employee of $71,851.
The top-performing contractors—based on a composite ranking of five performance metrics (ROA, ROE, debt to equity, fixed-asset ratios, and gross profit per employee)—were head and shoulders above respondent averages.
The highest achievers reported a 24% Return on Assets and 58.5% Return on Equity, substantively higher on both counts than the survey’s averages noted above.
Best in Class companies also reported less debt (1.2 times debt-to-equity versus 1.8 times for all respondents) and a more stable fixed asset ratio (16.6% versus 25.1% for all respondents). All respondents averaged a 15% gross profit margin, while the Best in Class companies achieved an 18.4% margin. Further, all respondents earned a 4.4% net income before taxes, compared with the highest achievers, which averaged 8.4% margin.
The CFMA survey was compiled and analyzed by Industry Insights and the organization’s Financial Survey & Benchmarker Committee. It did not provide explanations about why some contractors performed better than others.
Related Stories

| Feb 10, 2012
Atlanta Housing Authority taps Johnson Controls to improve public housing efficiency
Energy-efficiency program to improve 13 senior residential care facilities and save nearly $18 million.

| Feb 10, 2012
Besculides joins New York Office of Perkins Eastman as associate principal
Besculides joins with more than 17 years’ experience in design, business development, and account management for the government, healthcare, and corporate practice areas with a particular focus on the financial and media sectors.

| Feb 10, 2012
Mortenson Construction research identifies healthcare industry and facility design trends
The 2012 Mortenson Construction Healthcare Industry Study includes insights and perspectives regarding government program concerns, the importance of lean operations, flexible facility design, project delivery trends, improving patient experience, and evidence-based design.

| Feb 10, 2012
LAX Central Utility Plant project tops out
Construction workers placed the final structural steel beam atop the Plant, which was designed with strict seismic criteria to help protect the facility and airport utilities during an earthquake.

| Feb 8, 2012
Nauset completes addition and renovation for Winchester senior living community
Theater, library, fitness center, and bistro enhance facility.

| Feb 8, 2012
Mega-malls expanding internationally
Historically, malls have always been the icons of America – the first mall ever was built in Minneapolis in 1956.

| Feb 8, 2012
World’s tallest solar PV-installation
The solar array is at the elevation of 737 feet, making the building the tallest in the world with a solar PV-installation on its roof.

| Feb 7, 2012
AIA introduces seven new contract documents to Documents-On-Demand service??
AIA Contract Documents are widely-used standard form contracts among the building industry to support construction and design projects.

| Feb 7, 2012
Data center construction boom driven by healthcare and technology
The study includes insight and perspective regarding current investment plans of stakeholders, potential challenges to the data center boom, data center efficiency levels, the impact of new designs and technologies, and delivery methods.

| Feb 7, 2012
Shepley Bulfinch opens San Francisco office
This expansion establishes a physical presence that builds on a portfolio of work for institutional clients on the West Coast, dating to the development of the original Stanford University campus in 1891


