


In a recent survey, nearly 900 construction firms reported gains in profitability last year, especially among the top 25% whose financial performances significantly outpaced the respondents as a whole.
The Construction Financial Management Association (CFMA), headquartered in Princeton, N.J., emailed its annual questionnaire to about 8,000 member and nonmember construction firms, as well as member CPA firms that represent construction companies. CFMA received data from 869 companies, which submitted detailed financial statements and other required information.
Thirty-seven percent of the respondents were Industrial & Nonresidential contractors, 19% Heavy & Highway contractors, 43% Specialty Trade contractors, and less than 1% classified as “Other.” The typical company reported total annual sales of $39,710,000 for the 2015 fiscal year. Those with sales under $10 million comprised 16% of responding companies, and 8% of respondents reported sales of over $300 million.
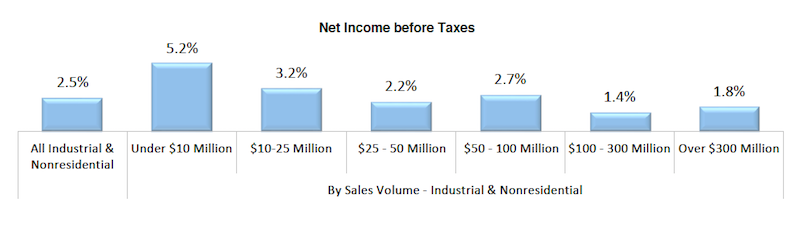
Smaller contracting companies showed stronger earnings last year. Chart: Construction Financial Management Association.
On average, the respondents’ returns on assets and equity rose last year. Returns on Assets was 9%, versus 6.9% in 2014. Returns on equity jumped to 25.3% in 2015, from 19% the previous year.
On the whole, getting paid for services rendered remains a struggle. The respondents’ invoices were in accounts receivable for an average of 55.2 days last year, an increase over the previous two years. As for their accounts payable, the contractors reported a decline to 33.4 days last year, from 35.6 days in 2014.
Gross profits as a percentage of revenue increased to 15%, from 13.1% in 2014. And net income last year stood a 4.4% of sales, versus 3.1% the previous year.
CFMA broke out the financial data by sales volume, and found that companies generating under $10 million in revenue generally had higher profitability ratios than other cohorts. Perhaps coincidentally, the smaller companies had lower debt-to-equity ratios, and significantly lower “underbillings-to-equity” ratios (4.4%, compared to 15.6% for companies with $300 million or more in annual revenue).
Conversely, the largest companies by revenue were more productive, reporting sales per employee of $751,348 ($276,000 more per employee than companies with between $100 million and $300 million in sales, and even higher compared to the other groups), and gross profit per employee of $71,851.
The top-performing contractors—based on a composite ranking of five performance metrics (ROA, ROE, debt to equity, fixed-asset ratios, and gross profit per employee)—were head and shoulders above respondent averages.
The highest achievers reported a 24% Return on Assets and 58.5% Return on Equity, substantively higher on both counts than the survey’s averages noted above.
Best in Class companies also reported less debt (1.2 times debt-to-equity versus 1.8 times for all respondents) and a more stable fixed asset ratio (16.6% versus 25.1% for all respondents). All respondents averaged a 15% gross profit margin, while the Best in Class companies achieved an 18.4% margin. Further, all respondents earned a 4.4% net income before taxes, compared with the highest achievers, which averaged 8.4% margin.
The CFMA survey was compiled and analyzed by Industry Insights and the organization’s Financial Survey & Benchmarker Committee. It did not provide explanations about why some contractors performed better than others.
Related Stories

| Jan 10, 2013
Guide predicts strongest, weakest AEC markets for 2013
2013 Guide to U.S. AEC markets touts apartments, natural gas, senior housing and transmission and distribution.

| Jan 8, 2013
PC Construction names McCarthy President/CEO
McCarthy, who joined PC Construction in 1998 and currently serves as executive vice president, will become a member of the employee-owned company’s board of directors and a trustee of the employee stock ownership plan.

| Jan 3, 2013
Answered prayers
A bold renovation enables a small church to expand its mission on a grand scale.

| Jan 2, 2013
M&A activity at U.S. AEC firms up slightly
Total mergers and acquisitions in the AEC industry hit 171 in 2012, up slight from the 169 deals in 2011.

| Jan 2, 2013
Construction jobs made gains in 2012, even with a slow Q4, says Gilbane report
The construction sector in the nine states with 50% of construction employment was up 169,000 jobs from February to September 2012, following a lost of 137,000 jobs from September 2011 to January 2012.

| Dec 21, 2012
ABI gains for fourth straight month
Positive business conditions for all building sectors.
| Dec 13, 2012
LPCiminelli opens New York City office
Steve Giordano named executive in charge of new office.


