


In a recent survey, nearly 900 construction firms reported gains in profitability last year, especially among the top 25% whose financial performances significantly outpaced the respondents as a whole.
The Construction Financial Management Association (CFMA), headquartered in Princeton, N.J., emailed its annual questionnaire to about 8,000 member and nonmember construction firms, as well as member CPA firms that represent construction companies. CFMA received data from 869 companies, which submitted detailed financial statements and other required information.
Thirty-seven percent of the respondents were Industrial & Nonresidential contractors, 19% Heavy & Highway contractors, 43% Specialty Trade contractors, and less than 1% classified as “Other.” The typical company reported total annual sales of $39,710,000 for the 2015 fiscal year. Those with sales under $10 million comprised 16% of responding companies, and 8% of respondents reported sales of over $300 million.
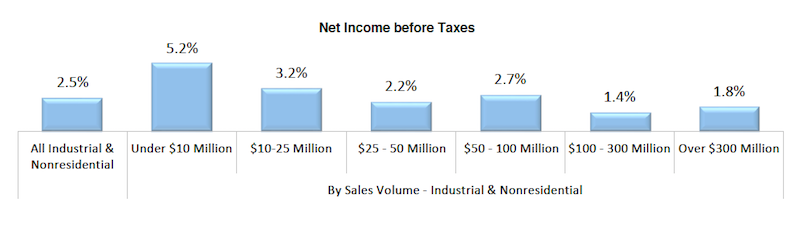
Smaller contracting companies showed stronger earnings last year. Chart: Construction Financial Management Association.
On average, the respondents’ returns on assets and equity rose last year. Returns on Assets was 9%, versus 6.9% in 2014. Returns on equity jumped to 25.3% in 2015, from 19% the previous year.
On the whole, getting paid for services rendered remains a struggle. The respondents’ invoices were in accounts receivable for an average of 55.2 days last year, an increase over the previous two years. As for their accounts payable, the contractors reported a decline to 33.4 days last year, from 35.6 days in 2014.
Gross profits as a percentage of revenue increased to 15%, from 13.1% in 2014. And net income last year stood a 4.4% of sales, versus 3.1% the previous year.
CFMA broke out the financial data by sales volume, and found that companies generating under $10 million in revenue generally had higher profitability ratios than other cohorts. Perhaps coincidentally, the smaller companies had lower debt-to-equity ratios, and significantly lower “underbillings-to-equity” ratios (4.4%, compared to 15.6% for companies with $300 million or more in annual revenue).
Conversely, the largest companies by revenue were more productive, reporting sales per employee of $751,348 ($276,000 more per employee than companies with between $100 million and $300 million in sales, and even higher compared to the other groups), and gross profit per employee of $71,851.
The top-performing contractors—based on a composite ranking of five performance metrics (ROA, ROE, debt to equity, fixed-asset ratios, and gross profit per employee)—were head and shoulders above respondent averages.
The highest achievers reported a 24% Return on Assets and 58.5% Return on Equity, substantively higher on both counts than the survey’s averages noted above.
Best in Class companies also reported less debt (1.2 times debt-to-equity versus 1.8 times for all respondents) and a more stable fixed asset ratio (16.6% versus 25.1% for all respondents). All respondents averaged a 15% gross profit margin, while the Best in Class companies achieved an 18.4% margin. Further, all respondents earned a 4.4% net income before taxes, compared with the highest achievers, which averaged 8.4% margin.
The CFMA survey was compiled and analyzed by Industry Insights and the organization’s Financial Survey & Benchmarker Committee. It did not provide explanations about why some contractors performed better than others.
Related Stories

University Buildings | May 19, 2015
Renovate or build new: How to resolve the eternal question
With capital budgets strained, renovation may be an increasingly attractive money-saving option for many college and universities.

University Buildings | May 19, 2015
KU Jayhawks take a gander at a P3 development
The P3 concept is getting a tryout at the University of Kansas, where state funding for construction has fallen from 20% of project costs to about 11% over the last 10 years.

Retail Centers | May 18, 2015
ULI forecast sees clear skies for real estate over next three years
With asset availability declining in several sectors, rents and transactions should rise.

Contractors | May 18, 2015
Gilbane foresees double-digit growth in construction spending in 2015
In its Spring outlook, the construction company frets about hiring patterns that aren’t fully taking a project’s workload into account.

Architects | May 10, 2015
Harness the connection between managing risk and increasing profitability, Part 2
In Part 1, we covered taking control of the submittals schedule and managing RFIs. Let’s move on to properly allocating substitutions and limiting change orders.

Contractors | May 8, 2015
Trends in U.S. commercial building size in three charts
A new study by the U.S. Energy Information Administration shows that there were 5.6 million commercial buildings in the U.S. in 2012, totaling 87 billion sf of floor space. This is a 14% increase in floor space since 2003.

Building Team | May 8, 2015
Construction industry adds 45,000 jobs in April
The construction industry saw an increase in jobs during the month of April after losing approximately 9,000 positions in March.

Building Team | May 8, 2015
Surety bond forms specifically for design-build projects now available
The documents are the first of their kind to be coauthored by designers and builders.

Engineers | May 6, 2015
Megadeals drive mergers and acquisitions in engineering and construction industry: FMI report
Large deals and the convergence of design and construction are spurring M&A activity in the engineering and construction industry, according to the FMI Mergers & Acquisitions Trends report.

High-rise Construction | May 6, 2015
Parks in the sky? Subterranean bike paths? Meet the livable city, designed in 3D
Today’s great cities must be resilient—and open—to many things, including the influx of humanity, writes Gensler co-CEO Andy Cohen.


