


In a recent survey, nearly 900 construction firms reported gains in profitability last year, especially among the top 25% whose financial performances significantly outpaced the respondents as a whole.
The Construction Financial Management Association (CFMA), headquartered in Princeton, N.J., emailed its annual questionnaire to about 8,000 member and nonmember construction firms, as well as member CPA firms that represent construction companies. CFMA received data from 869 companies, which submitted detailed financial statements and other required information.
Thirty-seven percent of the respondents were Industrial & Nonresidential contractors, 19% Heavy & Highway contractors, 43% Specialty Trade contractors, and less than 1% classified as “Other.” The typical company reported total annual sales of $39,710,000 for the 2015 fiscal year. Those with sales under $10 million comprised 16% of responding companies, and 8% of respondents reported sales of over $300 million.
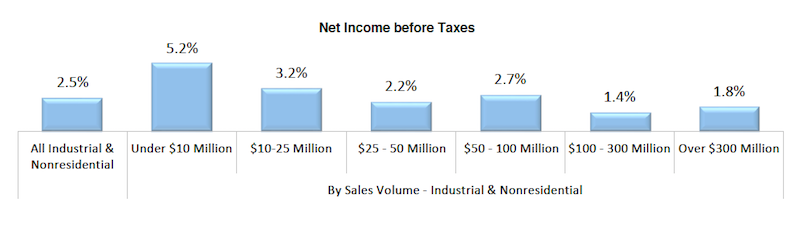
Smaller contracting companies showed stronger earnings last year. Chart: Construction Financial Management Association.
On average, the respondents’ returns on assets and equity rose last year. Returns on Assets was 9%, versus 6.9% in 2014. Returns on equity jumped to 25.3% in 2015, from 19% the previous year.
On the whole, getting paid for services rendered remains a struggle. The respondents’ invoices were in accounts receivable for an average of 55.2 days last year, an increase over the previous two years. As for their accounts payable, the contractors reported a decline to 33.4 days last year, from 35.6 days in 2014.
Gross profits as a percentage of revenue increased to 15%, from 13.1% in 2014. And net income last year stood a 4.4% of sales, versus 3.1% the previous year.
CFMA broke out the financial data by sales volume, and found that companies generating under $10 million in revenue generally had higher profitability ratios than other cohorts. Perhaps coincidentally, the smaller companies had lower debt-to-equity ratios, and significantly lower “underbillings-to-equity” ratios (4.4%, compared to 15.6% for companies with $300 million or more in annual revenue).
Conversely, the largest companies by revenue were more productive, reporting sales per employee of $751,348 ($276,000 more per employee than companies with between $100 million and $300 million in sales, and even higher compared to the other groups), and gross profit per employee of $71,851.
The top-performing contractors—based on a composite ranking of five performance metrics (ROA, ROE, debt to equity, fixed-asset ratios, and gross profit per employee)—were head and shoulders above respondent averages.
The highest achievers reported a 24% Return on Assets and 58.5% Return on Equity, substantively higher on both counts than the survey’s averages noted above.
Best in Class companies also reported less debt (1.2 times debt-to-equity versus 1.8 times for all respondents) and a more stable fixed asset ratio (16.6% versus 25.1% for all respondents). All respondents averaged a 15% gross profit margin, while the Best in Class companies achieved an 18.4% margin. Further, all respondents earned a 4.4% net income before taxes, compared with the highest achievers, which averaged 8.4% margin.
The CFMA survey was compiled and analyzed by Industry Insights and the organization’s Financial Survey & Benchmarker Committee. It did not provide explanations about why some contractors performed better than others.
Related Stories
Contractors | Apr 9, 2018
Tech Report 5.0: Smart(er) Jobsites
Real-time construction analysis, just-in-time materials delivery, digital production planning systems—these are just a few of the novel approaches construction firms are implementing to take control of their jobsites.

Market Data | Apr 2, 2018
Construction spending in February inches up from January
Association officials urge federal, state and local officials to work quickly to put recently enacted funding increases to work to improve aging and over-burdened infrastructure, offset public-sector spending drops.

Contractors | Mar 27, 2018
Shawmut Design and Construction’s burgeoning L.A. office looks to hospitality and interiors for future growth
A new division also taps the luxury homes market.

Contractors | Mar 9, 2018
Undoing 5 myths of IPD and Lean construction
The Lean Construction Institute, one of this year’s Movers+Shapers, has been sponsoring valuable research recently.
Contractors | Mar 6, 2018
Skender revolutionizes how the industry builds, integrates design, construction, and manufacturing
Envisioning a radically more efficient future for the building industry, Skender announces its expansion beyond construction, becoming a vertically integrated company including construction, design and building component manufacturing functions. The expansion includes significant investment in the launch of a new Chicago-based advanced manufacturing subsidiary and the acquisition of the boutique design firm Ingenious Architecture.

Multifamily Housing | Mar 4, 2018
Katerra, a tech-driven GC, plots ambitious expansion
Investors flock to this vertically integrated startup, which automates its design and construction processes.

Office Buildings | Feb 13, 2018
Office market vacancy rate at 10-year low
Cautious development and healthy absorption across major markets contributed to the decline in vacancy, according to a new Transwestern report.

Contractors | Feb 2, 2018
Construction employers add 36,000 jobs in January and 226,000 over the year
Industry employment is most since August 2008 As unemployment rate falls sharply.

Healthcare Facilities | Feb 1, 2018
Early supplier engagement provides exceptional project outcomes
Efficient supply chains enable companies to be more competitive in the marketplace.

Industry Research | Jan 30, 2018
AIA’s Kermit Baker: Five signs of an impending upturn in construction spending
Tax reform implications and rebuilding from natural disasters are among the reasons AIA’s Chief Economist is optimistic for 2018 and 2019.


