


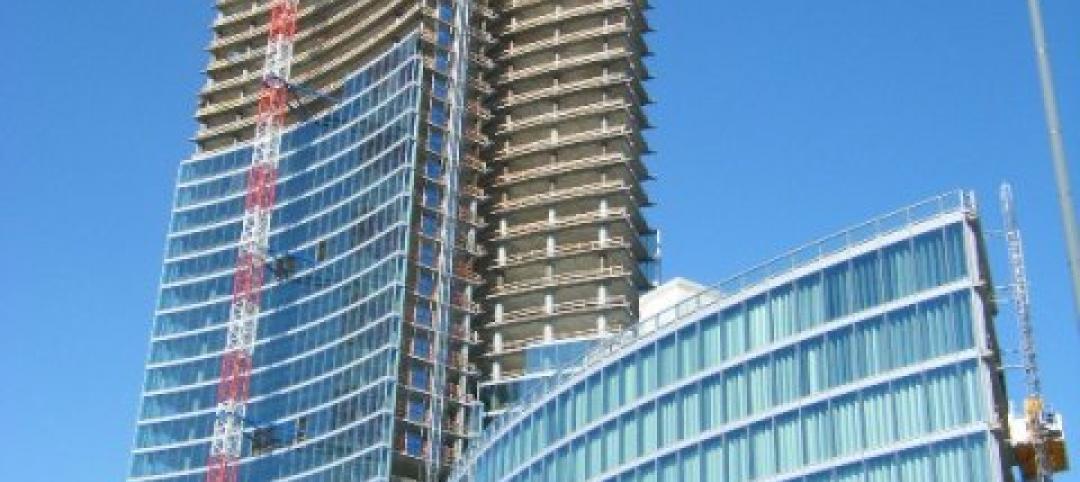
Two of the biggest players in nonresidential construction are predicting a turnaround in the industry, despite the malaise in the general economy. “We feel that the construction market is moving off the bottom and finally showing signs of improvement,” says Nicholas Makes, Senior Vice President at the Turner Corporation. “We have been preparing for an upturn.”
Moreover, in its Spring 2012 edition of “Construction Economics – Market Conditions in Construction,” Gilbane Building Co. forecasts a 5.4% increase from 2011 in spending for all construction, a 6.2% increase for nonresidential buildings, and a 9.8% growth for private-sector work. However, spending also has a ways to go before reaching pre-recession levels: The predicted figure for private construction (including single-family homes) in 2012—$555 billion—is roughly 40% below the $912 billion mark for 2006.
Giants 300 construction firms are reporting that predominantly private institutional sectors, notably healthcare, are still seeing activity. “The intensity for jobs is great, as construction activity declines in state and local government work,” notes Dale Connor, Managing Director, Project Management and Construction (Americas) with Lend Lease. “Capital availability remains tight but is improving, and markets like healthcare and life sciences remain active.”
SCROLL DOWN FOR GIANTS 300 CONTRACTOR & CM AGENT + PM FIRM RANKINGS
Contractors are also seeing opportunities in markets outside the United States. Turner recently opened offices in Toronto and Vancouver and is partnering with Edmonton-based Clark Builders. In Mexico, the firm is currently working on several data centers as well as on a 51-story Latin America headquarters tower for Spanish banking group BBVA. Turner also opened new offices in Vietnam, Malaysia, and Turkey.
Rising costs, fewer skilled laborers
One concern contractors are bracing for is the rising cost of certain materials. “Metals are up due to increased world demand, which is affecting the MEP trades,” says Lend Lease’s Connor. Shortages of aluminum could affect the cost of building envelope materials, and rising oil prices are impacting the costs of building products such as drywall and glass.
Gilbane reports that concrete and steel are both experiencing cost increases ranging between 1.5% and 2.5% over the year. The overall Producer Price Index for February 2012 showed costs for construction materials up 4.4% in the previous 12 months.
Moreover, the Gilbane report says, while construction unemployment has dropped from 25% in February 2010 to 17% in March 2012, the actual number of construction jobs gained has remained flat, due to laborers actually dropping out of the workforce. The Gilbane study forecasts that when work volume begins to increase, labor costs will go up due to a lack of skilled workers.
Increasing efficiencies
Contractors and CM firms are reporting positive benefits from the use of BIM and lean building practices. At Barton Malow, use of the integrated project delivery model continues to expand in an effort to improve project performance. “Our use of BIM and lean construction principles and our corporate culture of collaboration have made IPD a natural extension of our services,” says Senior Vice President Alex Ivanikiw, AIA, LEED AP.
Ivanikiw says that his firm has been testing technologies for practical job site applications at its new Envisioning Center, in Southfield, Mich. “The Envisioning Center is connected to a full-scale gang box in our atrium, simulating how the use of technologies would apply on the job site and how these technologies—hardware and software—need to be adapted for use in the field,” says Ivanikiw.
Turner says it is also focused on improving construction efficiencies. “With the adoption and development of BIM tools and processes, and with widespread implementation of lean construction practices and IPD methods, Turner is performing the same work it has always performed faster and more efficiently,” says Makes.
While construction volume is expected to pick up modestly in the coming year, “The cost of buildings still lags normal labor and material inflation cost indices,” notes the Gilbane report. “It should continue to do so for some time to come, but the gap is narrowing.” +
CONTRACTORS
| Rank | Company | 2011 Total Revenue ($) |
| 1 | Turner Corporation, The | 8,014,660,000 |
| 2 | Whiting-Turner Contracting Co., The | 3,826,610,062 |
| 3 | PCL Construction Enterprises | 3,611,192,729 |
| 4 | Balfour Beatty US | 3,428,962,433 |
| 5 | Clark Group | 3,380,129,779 |
| 6 | Skanska USA | 3,286,508,000 |
| 7 | Gilbane Building Co. | 3,028,728,000 |
| 8 | Mortenson | 2,456,960,000 |
| 9 | Tutor Perini Corp. | 2,360,916,000 |
| 10 | Structure Tone | 2,347,400,000 |
| 11 | Hensel Phelps Construction | 2,229,390,000 |
| 12 | McCarthy Holdings | 2,096,000,000 |
| 13 | DPR Construction | 2,000,332,304 |
| 14 | Lend Lease | 1,841,990,112 |
| 15 | Holder Construction | 1,766,000,000 |
| 16 | Hunt Construction Group | 1,750,000,000 |
| 17 | JE Dunn Construction | 1,716,858,016 |
| 18 | Jacobs | 1,644,500,000 |
| 19 | Walsh Group, The | 1,612,052,187 |
| 20 | Brasfield & Gorrie | 1,492,346,677 |
| 21 | Suffolk Construction | 1,425,000,000 |
| 22 | Barton Malow | 1,256,757,360 |
| 23 | Swinerton | 1,079,236,051 |
| 24 | Pepper Construction Group | 1,050,711,000 |
| 25 | Flintco | 1,003,400,000 |
| 26 | HITT Contracting | 976,397,916 |
| 27 | Yates Companies, The | 910,200,000 |
| 28 | Weitz Company, The | 881,339,956 |
| 29 | Walbridge | 867,900,000 |
| 30 | Clayco | 820,000,000 |
| 31 | Webcor Builders | 797,040,000 |
| 32 | Austin Industries | 776,534,824 |
| 33 | Ryan Companies US | 697,549,225 |
| 34 | CORE Construction | 671,535,195 |
| 35 | Shawmut Design and Construction | 662,800,000 |
| 36 | Power Construction | 654,000,000 |
| 37 | Sundt Construction | 644,029,962 |
| 38 | Boldt Co., The | 632,115,183 |
| 39 | Robins & Morton | 623,293,000 |
| 40 | BL Harbert International | 617,300,000 |
| 41 | James G. Davis Construction Corp. | 603,020,000 |
| 42 | Layton Construction | 601,200,000 |
| 43 | Haskell | 577,518,226 |
| 44 | McShane Companies, The | 562,442,191 |
| 45 | Messer Construction | 550,808,643 |
| 46 | Gray Construction | 514,039,421 |
| 47 | Hoar Construction | 503,668,000 |
| 48 | Kraus-Anderson Construction | 497,180,000 |
| 49 | Choate Construction | 482,410,138 |
| 50 | Hardin Construction | 477,879,091 |
| 51 | McGough | 477,000,000 |
| 52 | EMJ Corp. | 475,575,404 |
| 53 | O’Neil Industries / W.E. O’Neil | 458,290,000 |
| 54 | Bernards | 438,045,000 |
| 55 | Manhattan Construction Group | 423,285,000 |
| 56 | Kitchell | 407,469,000 |
| 57 | C.W. Driver | 401,952,720 |
| 58 | W. M. Jordan Co. | 377,529,253 |
| 59 | Linbeck Group | 324,000,000 |
| 60 | Rodgers Builders | 313,392,000 |
| 61 | S. M. Wilson & Co. | 300,581,922 |
| 62 | Paric Corp. | 285,000,000 |
| 63 | HBE Corp. | 279,200,000 |
| 64 | E.W. Howell | 266,485,000 |
| 65 | Hunt Companies | 263,902,629 |
| 66 | Clancy & Theys Construction | 253,468,947 |
| 67 | Hill & Wilkinson General Contractors | 253,101,000 |
| 68 | Coakley & Williams Construction | 236,521,534 |
| 69 | Weis Builders | 219,006,000 |
| 70 | Alberici Corp. | 218,453,766 |
| 71 | Doster Construction | 210,187,139 |
| 72 | Batson-Cook | 208,907,584 |
| 73 | Harkins Builders | 201,000,000 |
| 74 | KBE Building Corp. | 187,822,953 |
| 75 | Heery International | 134,514,000 |
| 76 | New South Construction | 187,706,000 |
| 77 | Consigli Construction | 174,112,428 |
| 78 | Bette Companies | 144,000,000 |
| 79 | CG Schmidt | 142,265,000 |
| 80 | Absher Construction | 130,129,012 |
| 81 | Atkins North America | 115,430,980 |
| 82 | James McHugh Construction | 102,622,708 |
| 83 | Bomel Construction | 99,930,000 |
| 84 | IMC Construction | 93,500,000 |
| 85 | Wight & Co. | 77,807,100 |
| 86 | URS Corp. | 76,986,048 |
| 87 | Roche Constructors | 75,272,999 |
| 88 | Summit Contractors Group | 64,000,000 |
| 89 | Stalco Construction | 58,800,000 |
| 90 | Allen & Shariff Corp. | 38,323,273 |
| 91 | Jones Lang LaSalle | 20,000,000 |
| 92 | Epstein | 16,860,278 |
| 93 | Eaton Energy Solutions | 13,773,148 |
| 94 | Zak Companies | 9,190,352 |
CM AGENT + PM FIRMS
| Rank | Company | 2011 Total Revenue ($) |
| 1 | Hoffman Corp. | 1,880,463,527 |
| 2 | Gilbane Building Co. | 1,350,248,000 |
| 3 | Manhattan Construction Group | 723,987,000 |
| 4 | Consigli Construction | 459,028,178 |
| 5 | Hill International | 350,000,000 |
| 6 | Jones Lang LaSalle | 301,000,000 |
| 7 | URS Corp. | 279,147,870 |
| 8 | JE Dunn Construction | 207,481,662 |
| 9 | Jacobs | 182,820,000 |
| 10 | Balfour Beatty US | 125,078,599 |
| 11 | Barton Malow | 94,594,640 |
| 12 | Structure Tone | 80,000,000 |
| 13 | Bernards | 79,655,000 |
| 14 | Robins & Morton | 75,380,000 |
| 15 | Lend Lease | 72,824,093 |
| 16 | Doster Construction | 20,682,865 |
| 17 | Flintco | 18,100,000 |
| 18 | Weitz Company, The | 18,060,000 |
| 19 | Allen & Shariff Corp. | 17,663,909 |
| 20 | Hoar Construction | 14,472,000 |
| 21 | McCarthy Holdings | 12,000,000 |
| 22 | Mortenson Construction | 10,640,000 |
| 23 | Swinerton | 10,528,949 |
| 24 | Power Construction | 9,000,000 |
| 25 | Yates Companies, The | 7,900,000 |
| 26 | Stalco Construction | 4,820,000 |
| 27 | Ryan Companies US | 4,587,011 |
| 28 | Brasfield & Gorrie | 4,248,485 |
| 29 | Kraus-Anderson Construction | 4,120,000 |
| 30 | Sundt Construction | 3,634,695 |
| 31 | S. M. Wilson & Co. | 3,507,170 |
| 32 | Pepper Construction Group | 3,028,000 |
| 33 | E.W. Howell Co. | 2,450,000 |
| 34 | Austin Industries | 2,383,128 |
| 35 | EMJ Corp. | 2,114,155 |
| 36 | Bette Companies, The | 2,000,000 |
| 37 | Eaton Energy Solutions | 1,931,409 |
| 38 | Hensel Phelps Construction | 1,500,000 |
| 39 | Haskell | 1,249,381 |
| 40 | Heery International | 1,011,000 |
| 41 | Epstein | 898,431 |
| 42 | Alberici Corp. | 806,353 |
| 43 | Gray Construction | 535,116 |
| 44 | IMC Construction | 500,000 |
| 45 | Rodgers Builders | 321,000 |
| 46 | Wight & Co. | 318,400 |
Related Stories
| Jan 10, 2013
Guide predicts strongest, weakest AEC markets for 2013
2013 Guide to U.S. AEC markets touts apartments, natural gas, senior housing and transmission and distribution.

| Jan 9, 2013
Panasonic and Bluebeam preview new architect app at CES 2013
Panasonic and Bluebeam Software collaborate to develop and introduce the 4K tablet and software to the design and construction industry.

| Jan 3, 2013
Answered prayers
A bold renovation enables a small church to expand its mission on a grand scale.

| Jan 3, 2013
Top BIM/VDC articles of 2011-2012
A compendium of BD+Cs top building information modeling and virtual design + construction articles from 2011-12.

| Jan 3, 2013
8 trends shaping today’s senior housing
The ranks of those age 65 and older are swelling by the thousands every day. Is there an opportunity for your firm in the seniors housing market?

| Jan 2, 2013
Trends Report: New facilities enhance the quality of campus life
Colleges and universities are building state-of-the-art student unions, dining halls, and other non-academic buildings to enrich the campus experience, boost enrollment, and stay competitive.

| Jan 2, 2013
M&A activity at U.S. AEC firms up slightly
Total mergers and acquisitions in the AEC industry hit 171 in 2012, up slight from the 169 deals in 2011.

| Jan 2, 2013
Global data center market to ‘slow’ to 14.3% this year
Total global investment in data centers is expected to slow down somewhat this year but still increase at a respectable 14.3%, according to DCD Intelligence.

| Jan 2, 2013
Construction jobs made gains in 2012, even with a slow Q4, says Gilbane report
The construction sector in the nine states with 50% of construction employment was up 169,000 jobs from February to September 2012, following a lost of 137,000 jobs from September 2011 to January 2012.


