


Two of the biggest players in nonresidential construction are predicting a turnaround in the industry, despite the malaise in the general economy. “We feel that the construction market is moving off the bottom and finally showing signs of improvement,” says Nicholas Makes, Senior Vice President at the Turner Corporation. “We have been preparing for an upturn.”
Moreover, in its Spring 2012 edition of “Construction Economics – Market Conditions in Construction,” Gilbane Building Co. forecasts a 5.4% increase from 2011 in spending for all construction, a 6.2% increase for nonresidential buildings, and a 9.8% growth for private-sector work. However, spending also has a ways to go before reaching pre-recession levels: The predicted figure for private construction (including single-family homes) in 2012—$555 billion—is roughly 40% below the $912 billion mark for 2006.
Giants 300 construction firms are reporting that predominantly private institutional sectors, notably healthcare, are still seeing activity. “The intensity for jobs is great, as construction activity declines in state and local government work,” notes Dale Connor, Managing Director, Project Management and Construction (Americas) with Lend Lease. “Capital availability remains tight but is improving, and markets like healthcare and life sciences remain active.”
SCROLL DOWN FOR GIANTS 300 CONTRACTOR & CM AGENT + PM FIRM RANKINGS
Contractors are also seeing opportunities in markets outside the United States. Turner recently opened offices in Toronto and Vancouver and is partnering with Edmonton-based Clark Builders. In Mexico, the firm is currently working on several data centers as well as on a 51-story Latin America headquarters tower for Spanish banking group BBVA. Turner also opened new offices in Vietnam, Malaysia, and Turkey.
Rising costs, fewer skilled laborers
One concern contractors are bracing for is the rising cost of certain materials. “Metals are up due to increased world demand, which is affecting the MEP trades,” says Lend Lease’s Connor. Shortages of aluminum could affect the cost of building envelope materials, and rising oil prices are impacting the costs of building products such as drywall and glass.
Gilbane reports that concrete and steel are both experiencing cost increases ranging between 1.5% and 2.5% over the year. The overall Producer Price Index for February 2012 showed costs for construction materials up 4.4% in the previous 12 months.
Moreover, the Gilbane report says, while construction unemployment has dropped from 25% in February 2010 to 17% in March 2012, the actual number of construction jobs gained has remained flat, due to laborers actually dropping out of the workforce. The Gilbane study forecasts that when work volume begins to increase, labor costs will go up due to a lack of skilled workers.
Increasing efficiencies
Contractors and CM firms are reporting positive benefits from the use of BIM and lean building practices. At Barton Malow, use of the integrated project delivery model continues to expand in an effort to improve project performance. “Our use of BIM and lean construction principles and our corporate culture of collaboration have made IPD a natural extension of our services,” says Senior Vice President Alex Ivanikiw, AIA, LEED AP.
Ivanikiw says that his firm has been testing technologies for practical job site applications at its new Envisioning Center, in Southfield, Mich. “The Envisioning Center is connected to a full-scale gang box in our atrium, simulating how the use of technologies would apply on the job site and how these technologies—hardware and software—need to be adapted for use in the field,” says Ivanikiw.
Turner says it is also focused on improving construction efficiencies. “With the adoption and development of BIM tools and processes, and with widespread implementation of lean construction practices and IPD methods, Turner is performing the same work it has always performed faster and more efficiently,” says Makes.
While construction volume is expected to pick up modestly in the coming year, “The cost of buildings still lags normal labor and material inflation cost indices,” notes the Gilbane report. “It should continue to do so for some time to come, but the gap is narrowing.” +
CONTRACTORS
| Rank | Company | 2011 Total Revenue ($) |
| 1 | Turner Corporation, The | 8,014,660,000 |
| 2 | Whiting-Turner Contracting Co., The | 3,826,610,062 |
| 3 | PCL Construction Enterprises | 3,611,192,729 |
| 4 | Balfour Beatty US | 3,428,962,433 |
| 5 | Clark Group | 3,380,129,779 |
| 6 | Skanska USA | 3,286,508,000 |
| 7 | Gilbane Building Co. | 3,028,728,000 |
| 8 | Mortenson | 2,456,960,000 |
| 9 | Tutor Perini Corp. | 2,360,916,000 |
| 10 | Structure Tone | 2,347,400,000 |
| 11 | Hensel Phelps Construction | 2,229,390,000 |
| 12 | McCarthy Holdings | 2,096,000,000 |
| 13 | DPR Construction | 2,000,332,304 |
| 14 | Lend Lease | 1,841,990,112 |
| 15 | Holder Construction | 1,766,000,000 |
| 16 | Hunt Construction Group | 1,750,000,000 |
| 17 | JE Dunn Construction | 1,716,858,016 |
| 18 | Jacobs | 1,644,500,000 |
| 19 | Walsh Group, The | 1,612,052,187 |
| 20 | Brasfield & Gorrie | 1,492,346,677 |
| 21 | Suffolk Construction | 1,425,000,000 |
| 22 | Barton Malow | 1,256,757,360 |
| 23 | Swinerton | 1,079,236,051 |
| 24 | Pepper Construction Group | 1,050,711,000 |
| 25 | Flintco | 1,003,400,000 |
| 26 | HITT Contracting | 976,397,916 |
| 27 | Yates Companies, The | 910,200,000 |
| 28 | Weitz Company, The | 881,339,956 |
| 29 | Walbridge | 867,900,000 |
| 30 | Clayco | 820,000,000 |
| 31 | Webcor Builders | 797,040,000 |
| 32 | Austin Industries | 776,534,824 |
| 33 | Ryan Companies US | 697,549,225 |
| 34 | CORE Construction | 671,535,195 |
| 35 | Shawmut Design and Construction | 662,800,000 |
| 36 | Power Construction | 654,000,000 |
| 37 | Sundt Construction | 644,029,962 |
| 38 | Boldt Co., The | 632,115,183 |
| 39 | Robins & Morton | 623,293,000 |
| 40 | BL Harbert International | 617,300,000 |
| 41 | James G. Davis Construction Corp. | 603,020,000 |
| 42 | Layton Construction | 601,200,000 |
| 43 | Haskell | 577,518,226 |
| 44 | McShane Companies, The | 562,442,191 |
| 45 | Messer Construction | 550,808,643 |
| 46 | Gray Construction | 514,039,421 |
| 47 | Hoar Construction | 503,668,000 |
| 48 | Kraus-Anderson Construction | 497,180,000 |
| 49 | Choate Construction | 482,410,138 |
| 50 | Hardin Construction | 477,879,091 |
| 51 | McGough | 477,000,000 |
| 52 | EMJ Corp. | 475,575,404 |
| 53 | O’Neil Industries / W.E. O’Neil | 458,290,000 |
| 54 | Bernards | 438,045,000 |
| 55 | Manhattan Construction Group | 423,285,000 |
| 56 | Kitchell | 407,469,000 |
| 57 | C.W. Driver | 401,952,720 |
| 58 | W. M. Jordan Co. | 377,529,253 |
| 59 | Linbeck Group | 324,000,000 |
| 60 | Rodgers Builders | 313,392,000 |
| 61 | S. M. Wilson & Co. | 300,581,922 |
| 62 | Paric Corp. | 285,000,000 |
| 63 | HBE Corp. | 279,200,000 |
| 64 | E.W. Howell | 266,485,000 |
| 65 | Hunt Companies | 263,902,629 |
| 66 | Clancy & Theys Construction | 253,468,947 |
| 67 | Hill & Wilkinson General Contractors | 253,101,000 |
| 68 | Coakley & Williams Construction | 236,521,534 |
| 69 | Weis Builders | 219,006,000 |
| 70 | Alberici Corp. | 218,453,766 |
| 71 | Doster Construction | 210,187,139 |
| 72 | Batson-Cook | 208,907,584 |
| 73 | Harkins Builders | 201,000,000 |
| 74 | KBE Building Corp. | 187,822,953 |
| 75 | Heery International | 134,514,000 |
| 76 | New South Construction | 187,706,000 |
| 77 | Consigli Construction | 174,112,428 |
| 78 | Bette Companies | 144,000,000 |
| 79 | CG Schmidt | 142,265,000 |
| 80 | Absher Construction | 130,129,012 |
| 81 | Atkins North America | 115,430,980 |
| 82 | James McHugh Construction | 102,622,708 |
| 83 | Bomel Construction | 99,930,000 |
| 84 | IMC Construction | 93,500,000 |
| 85 | Wight & Co. | 77,807,100 |
| 86 | URS Corp. | 76,986,048 |
| 87 | Roche Constructors | 75,272,999 |
| 88 | Summit Contractors Group | 64,000,000 |
| 89 | Stalco Construction | 58,800,000 |
| 90 | Allen & Shariff Corp. | 38,323,273 |
| 91 | Jones Lang LaSalle | 20,000,000 |
| 92 | Epstein | 16,860,278 |
| 93 | Eaton Energy Solutions | 13,773,148 |
| 94 | Zak Companies | 9,190,352 |
CM AGENT + PM FIRMS
| Rank | Company | 2011 Total Revenue ($) |
| 1 | Hoffman Corp. | 1,880,463,527 |
| 2 | Gilbane Building Co. | 1,350,248,000 |
| 3 | Manhattan Construction Group | 723,987,000 |
| 4 | Consigli Construction | 459,028,178 |
| 5 | Hill International | 350,000,000 |
| 6 | Jones Lang LaSalle | 301,000,000 |
| 7 | URS Corp. | 279,147,870 |
| 8 | JE Dunn Construction | 207,481,662 |
| 9 | Jacobs | 182,820,000 |
| 10 | Balfour Beatty US | 125,078,599 |
| 11 | Barton Malow | 94,594,640 |
| 12 | Structure Tone | 80,000,000 |
| 13 | Bernards | 79,655,000 |
| 14 | Robins & Morton | 75,380,000 |
| 15 | Lend Lease | 72,824,093 |
| 16 | Doster Construction | 20,682,865 |
| 17 | Flintco | 18,100,000 |
| 18 | Weitz Company, The | 18,060,000 |
| 19 | Allen & Shariff Corp. | 17,663,909 |
| 20 | Hoar Construction | 14,472,000 |
| 21 | McCarthy Holdings | 12,000,000 |
| 22 | Mortenson Construction | 10,640,000 |
| 23 | Swinerton | 10,528,949 |
| 24 | Power Construction | 9,000,000 |
| 25 | Yates Companies, The | 7,900,000 |
| 26 | Stalco Construction | 4,820,000 |
| 27 | Ryan Companies US | 4,587,011 |
| 28 | Brasfield & Gorrie | 4,248,485 |
| 29 | Kraus-Anderson Construction | 4,120,000 |
| 30 | Sundt Construction | 3,634,695 |
| 31 | S. M. Wilson & Co. | 3,507,170 |
| 32 | Pepper Construction Group | 3,028,000 |
| 33 | E.W. Howell Co. | 2,450,000 |
| 34 | Austin Industries | 2,383,128 |
| 35 | EMJ Corp. | 2,114,155 |
| 36 | Bette Companies, The | 2,000,000 |
| 37 | Eaton Energy Solutions | 1,931,409 |
| 38 | Hensel Phelps Construction | 1,500,000 |
| 39 | Haskell | 1,249,381 |
| 40 | Heery International | 1,011,000 |
| 41 | Epstein | 898,431 |
| 42 | Alberici Corp. | 806,353 |
| 43 | Gray Construction | 535,116 |
| 44 | IMC Construction | 500,000 |
| 45 | Rodgers Builders | 321,000 |
| 46 | Wight & Co. | 318,400 |
Related Stories

Healthcare Facilities | Jul 25, 2016
AIA selects seven winners of healthcare building design award
The National Healthcare Design Awards recognizes functional hospital projects that solve aesthetic, civic, urban, and social concerns. Recipients were selected in three categories this year.

Industrial Facilities | Jul 25, 2016
Snøhetta, Bjarke Ingels among four finalists for S.Pellegrino bottling plant design
A committee will evaluate proposals in September.

Architects | Jul 22, 2016
5 creative approaches to finish standards
With the right mindset, standards can produce great design for healthcare facilities, as VOA's Candace Small explores.

Retail Centers | Jul 21, 2016
MVRDV designs Seoul entertainment district with gold entrance and curtain façade
The 9,800-sm complex will have retail and nightclub space. A plaza separates the two concrete buildings.

Healthcare Facilities | Jul 20, 2016
Process mapping simplifies healthcare design
Charting procedures and highlighting improvement opportunities can lead to developing effective design strategy simulations. GS&P’s Ray Wong writes that process mapping adds value to a project and bolsters team and stakeholder collaboration.

Architects | Jul 20, 2016
AIA: Architecture Billings Index remains on solid footing
The June ABI score was down from May, but the figure was positive for the fifth consecutive month.

| Jul 19, 2016
2016 GIANTS 300 REPORT: Ranking the nation's largest architecture, engineering, and construction firms
Now in its 40th year, BD+C’s annual Giants 300 report ranks AEC firms by discipline and across more than 20 building sectors and specialty services.

Architects | Jul 18, 2016
17 buildings designed by Le Corbusier added to UNESCO World Heritage List
The sites are spread across seven counties and were built over the course of 50 years. Le Corbusier, an architect, designer, and urban planner, was a founder of modern architecture.

Multifamily Housing | Jul 18, 2016
Four residential projects named winners of the 2016 AIA/HUD Secretary Awards
Affordable housing, specialized housing, and accessible housing projects were honored.
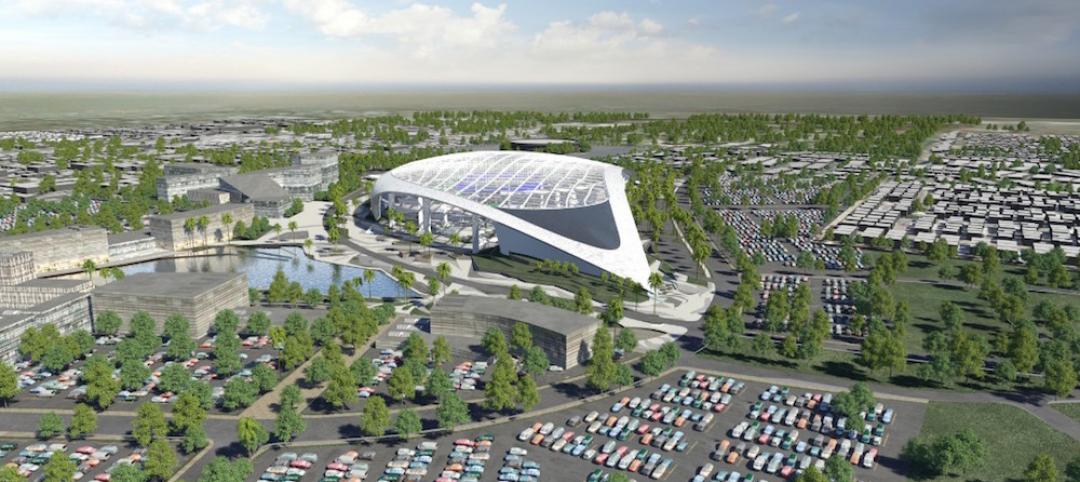
Sports and Recreational Facilities | Jul 18, 2016
Turner and AECOM will build the Los Angeles Rams’ new multi-billion dollar stadium project
The 70,000-seat stadium will be ready by the 2019 NFL season. The surrounding mixed-use development includes space for retail, hotels, and public parks.


