


According to a report released today by Associated Builders and Contractors (ABC), the private construction industry’s value added as a percentage of the nation’s real gross domestic product (GDP) rose to 4 in 2016, the highest level since 2009. The report also shows annual growth in real construction spending, which rose 3.5% in 2016. Thirty-seven states benefited from the rise in construction activity in their state, while 13 states experienced a reduction in activity.
“Although the relative impact of the value added by private construction on various state economies varies both among states in a particular year and within a state over time, every state benefits from construction activity,” said Bernard M. Markstein, Ph.D., president and chief economist of Markstein Advisors, who conducted the analysis and prepared the report for ABC. “The increase in that activity in a particular year adds to the income and potential growth of each state. A decline in that activity acts as a drag on a state’s economic performance.”
The 3.5% national increase in real construction spending was a slowdown from the 4.9% increase in 2015. Only 18 states had a greater growth in real construction spending in 2016 compared to 2015.

2016 CONSTRUCTION SPENDING: THE TOP FIVE STATES
The fastest growth was in the West and the South. The first state outside of those two regions in the ranking of construction growth rates is Rhode Island with the 16th largest increase (up 4.9%). In 2016, the top five states for the increase in their real value added from construction in order from highest to lowest were:
1. Idaho, up 10.7%
2. Georgia and South Carolina (tie), up 9.4%
4. Florida, up 9.3%
5. Oregon, up 9.1%
Idaho had the highest percentage contribution from construction, even though state real GDP advanced a respectable, but more modest, 1.8%. Georgia slipped from its number-one ranking in 2015, while South Carolina made a significant jump from 17th to second place.
Florida’s ranking of number four is down from second place in 2015 when its real construction spending was 11.1%. Oregon saw a big improvement from 33rd place in 2015.
2016 CONSTRUCTION SPENDING: THE BOTTOM FIVE STATES
All of the bottom five states suffered from the effects of low energy prices.
46. Mississippi, down 2.5%
47. West Virginia, down 7.5%
48. North Dakota, down 10.5%
49. Wyoming, down 11.5%
50. Alaska, down 13.2%
Alaska has struggled over the last few years. Not only did it experience the largest drop in real private construction spending in 2016, but it also experienced the second largest decrease in state GDP in the nation, down 5%. Real private construction spending has been down every year starting in 2011, except for 2015 (up 0.2%).
Although Wyoming improved its 2016 ranking—it had the largest decrease in 2015 at 6.6%—the 11.5% plunge was an acceleration of a bad outcome. North Dakota had the third largest decline in its real private construction spending in 2016 and 2015, down 10.5% and 4.1%, respectively. However, the state’s growth in construction spending ranked in the top 10 from 2008 through 2014.
West Virginia had the fourth largest decline in its real private construction spending in 2016 and 2015, down 7.5% and 3.1%, respectively. Mississippi’s 2016 decrease represents a slowdown in the decline in construction from 2014 and 2015, when private construction activity fell 8.6% and 5.6%, respectively.
Read the full report here.
Related Stories
Designers | Sep 13, 2016
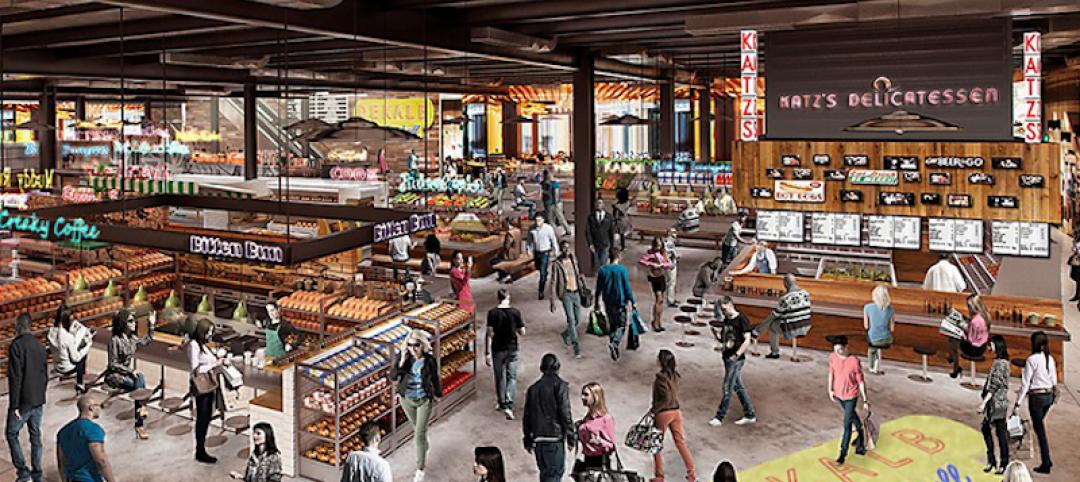
5 trends propelling a new era of food halls
Food halls have not only become an economical solution for restauranteurs and chefs experiencing skyrocketing retail prices and rents in large cities, but they also tap into our increased interest in gourmet locally sourced food, writes Gensler's Toshi Kasai.
Building Team | Sep 6, 2016
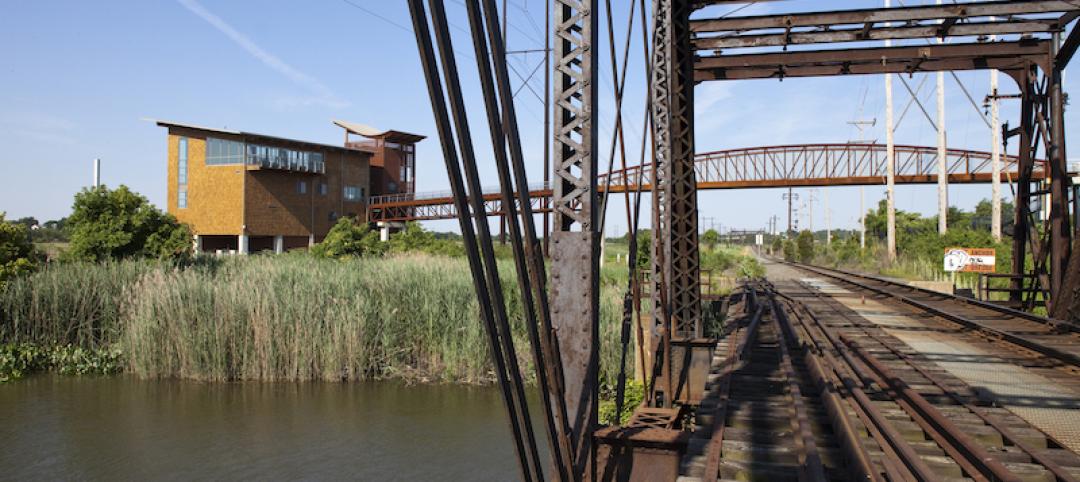
Letting your resource take center stage: A guide to thoughtful site selection for interpretive centers
Thoughtful site selection is never about one factor, but rather a confluence of several components that ultimately present trade-offs for the owner.

Market Data | Sep 2, 2016
Nonresidential spending inches lower in July while June data is upwardly revised to eight-year record
Nonresidential construction spending has been suppressed over the last year or so with the primary factor being the lack of momentum in public spending.

Industry Research | Sep 1, 2016
CannonDesign releases infographic to better help universities obtain more R&D funding
CannonDesign releases infographic to better help universities obtain more R&D funding.

Industry Research | Aug 25, 2016
Building bonds: The role of 'trusted advisor' is earned not acquired
A trusted advisor acts as a guiding partner over the full course of a professional relationship.

Multifamily Housing | Aug 17, 2016
A new research platform launches for a data-deprived multifamily sector
The list of leading developers, owners, and property managers that are funding the NMHC Research Foundation speaks to the information gap it hopes to fill.

Hotel Facilities | Aug 17, 2016
Hotel construction continues to flourish in major cities
But concerns about overbuilding persist.

Market Data | Aug 16, 2016
Leading economists predict construction industry growth through 2017
The Chief Economists for ABC, AIA, and NAHB all see the construction industry continuing to expand over the next year and a half.

Multifamily Housing | Aug 12, 2016
Apartment completions in largest metros on pace to increase by 50% in 2016
Texas is leading this multifamily construction boom, according to latest RENTCafé estimates.

Market Data | Jul 29, 2016
ABC: Output expands, but nonresidential fixed investment falters
Nonresidential fixed investment fell for a third consecutive quarter, as indicated by Bureau of Economic Analysis data.


