


According to a report released today by Associated Builders and Contractors (ABC), the private construction industry’s value added as a percentage of the nation’s real gross domestic product (GDP) rose to 4 in 2016, the highest level since 2009. The report also shows annual growth in real construction spending, which rose 3.5% in 2016. Thirty-seven states benefited from the rise in construction activity in their state, while 13 states experienced a reduction in activity.
“Although the relative impact of the value added by private construction on various state economies varies both among states in a particular year and within a state over time, every state benefits from construction activity,” said Bernard M. Markstein, Ph.D., president and chief economist of Markstein Advisors, who conducted the analysis and prepared the report for ABC. “The increase in that activity in a particular year adds to the income and potential growth of each state. A decline in that activity acts as a drag on a state’s economic performance.”
The 3.5% national increase in real construction spending was a slowdown from the 4.9% increase in 2015. Only 18 states had a greater growth in real construction spending in 2016 compared to 2015.

2016 CONSTRUCTION SPENDING: THE TOP FIVE STATES
The fastest growth was in the West and the South. The first state outside of those two regions in the ranking of construction growth rates is Rhode Island with the 16th largest increase (up 4.9%). In 2016, the top five states for the increase in their real value added from construction in order from highest to lowest were:
1. Idaho, up 10.7%
2. Georgia and South Carolina (tie), up 9.4%
4. Florida, up 9.3%
5. Oregon, up 9.1%
Idaho had the highest percentage contribution from construction, even though state real GDP advanced a respectable, but more modest, 1.8%. Georgia slipped from its number-one ranking in 2015, while South Carolina made a significant jump from 17th to second place.
Florida’s ranking of number four is down from second place in 2015 when its real construction spending was 11.1%. Oregon saw a big improvement from 33rd place in 2015.
2016 CONSTRUCTION SPENDING: THE BOTTOM FIVE STATES
All of the bottom five states suffered from the effects of low energy prices.
46. Mississippi, down 2.5%
47. West Virginia, down 7.5%
48. North Dakota, down 10.5%
49. Wyoming, down 11.5%
50. Alaska, down 13.2%
Alaska has struggled over the last few years. Not only did it experience the largest drop in real private construction spending in 2016, but it also experienced the second largest decrease in state GDP in the nation, down 5%. Real private construction spending has been down every year starting in 2011, except for 2015 (up 0.2%).
Although Wyoming improved its 2016 ranking—it had the largest decrease in 2015 at 6.6%—the 11.5% plunge was an acceleration of a bad outcome. North Dakota had the third largest decline in its real private construction spending in 2016 and 2015, down 10.5% and 4.1%, respectively. However, the state’s growth in construction spending ranked in the top 10 from 2008 through 2014.
West Virginia had the fourth largest decline in its real private construction spending in 2016 and 2015, down 7.5% and 3.1%, respectively. Mississippi’s 2016 decrease represents a slowdown in the decline in construction from 2014 and 2015, when private construction activity fell 8.6% and 5.6%, respectively.
Read the full report here.
Related Stories
Market Data | May 12, 2020
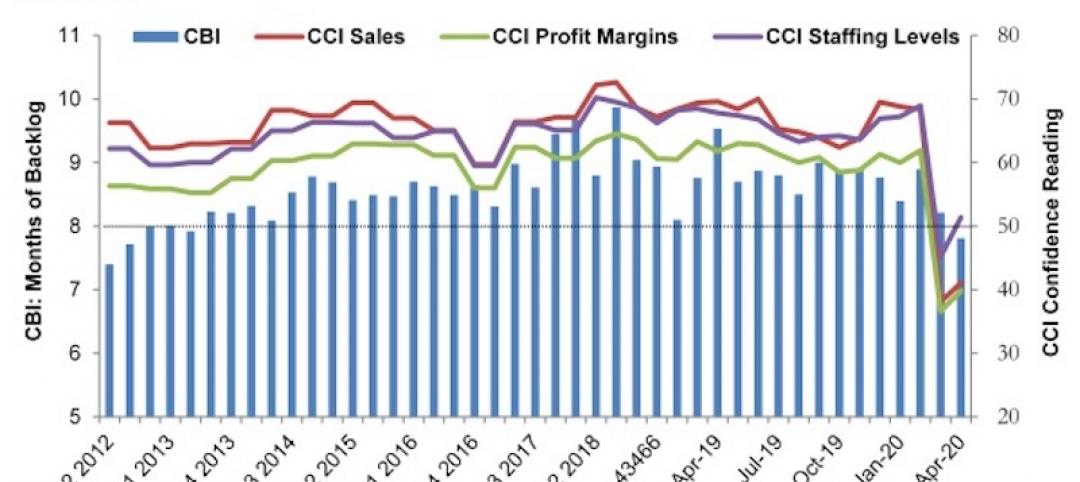
ABC’s Construction Backlog Indicator falls in April; Contractor Confidence rebounds from historic lows
Nonresidential construction backlog is down 0.4 months compared to the March 2020 ABC survey and 1.7 months from April 2019.

Market Data | May 12, 2020
6 must reads for the AEC industry today: May 12, 2020
A 13-point plan to reduce coronavirus deaths in nursing homes and Bjarke Ingels discusses building on Mars.

Market Data | May 11, 2020
Interest in eSports is booming amid COVID-19
The industry has proved largely immune to the COVID-19 pandemic due to its prompt transition into online formats and sudden spike in interest from traditional sports organizations.

Market Data | May 11, 2020
6 must reads for the AEC industry today: May 11, 2020
Nashville residential tower will rise 416 feet and the construction industry loses 975,000 jobs.

Market Data | May 8, 2020
Construction industry loses 975,000 jobs in April as new association survey shows deteriorating demand for construction projects
Association partner Procore also releases near real-time construction data measuring impacts of coronavirus as association calls for new measures.

Market Data | May 8, 2020
7 must reads for the AEC industry today: May 8, 2020
The death of the office and Colorado's first multifamily project to receive WELL Precertification.

Market Data | May 7, 2020
5 must reads for the AEC industry today: May 7, 2020
5 memory care communities with a strong sense of mission and making jobsites safer in the COVID-19 world.

Market Data | May 6, 2020
6 must reads for the AEC industry today: May 6, 2020
5 questions engineers will ask after COVID-19 and coronavirus threatens push for denser housing.

Market Data | May 5, 2020
5 must reads for the AEC industry today: May 5, 2020
A new temporary hospital pops up in N.J., and apartment firms' reactivation plans begin to take shape.

Market Data | May 4, 2020
6 must reads for the AEC industry today: May 4, 2020
How working from home is influencing design and is this the end of the open office?


