


According to a report released today by Associated Builders and Contractors (ABC), the private construction industry’s value added as a percentage of the nation’s real gross domestic product (GDP) rose to 4 in 2016, the highest level since 2009. The report also shows annual growth in real construction spending, which rose 3.5% in 2016. Thirty-seven states benefited from the rise in construction activity in their state, while 13 states experienced a reduction in activity.
“Although the relative impact of the value added by private construction on various state economies varies both among states in a particular year and within a state over time, every state benefits from construction activity,” said Bernard M. Markstein, Ph.D., president and chief economist of Markstein Advisors, who conducted the analysis and prepared the report for ABC. “The increase in that activity in a particular year adds to the income and potential growth of each state. A decline in that activity acts as a drag on a state’s economic performance.”
The 3.5% national increase in real construction spending was a slowdown from the 4.9% increase in 2015. Only 18 states had a greater growth in real construction spending in 2016 compared to 2015.

2016 CONSTRUCTION SPENDING: THE TOP FIVE STATES
The fastest growth was in the West and the South. The first state outside of those two regions in the ranking of construction growth rates is Rhode Island with the 16th largest increase (up 4.9%). In 2016, the top five states for the increase in their real value added from construction in order from highest to lowest were:
1. Idaho, up 10.7%
2. Georgia and South Carolina (tie), up 9.4%
4. Florida, up 9.3%
5. Oregon, up 9.1%
Idaho had the highest percentage contribution from construction, even though state real GDP advanced a respectable, but more modest, 1.8%. Georgia slipped from its number-one ranking in 2015, while South Carolina made a significant jump from 17th to second place.
Florida’s ranking of number four is down from second place in 2015 when its real construction spending was 11.1%. Oregon saw a big improvement from 33rd place in 2015.
2016 CONSTRUCTION SPENDING: THE BOTTOM FIVE STATES
All of the bottom five states suffered from the effects of low energy prices.
46. Mississippi, down 2.5%
47. West Virginia, down 7.5%
48. North Dakota, down 10.5%
49. Wyoming, down 11.5%
50. Alaska, down 13.2%
Alaska has struggled over the last few years. Not only did it experience the largest drop in real private construction spending in 2016, but it also experienced the second largest decrease in state GDP in the nation, down 5%. Real private construction spending has been down every year starting in 2011, except for 2015 (up 0.2%).
Although Wyoming improved its 2016 ranking—it had the largest decrease in 2015 at 6.6%—the 11.5% plunge was an acceleration of a bad outcome. North Dakota had the third largest decline in its real private construction spending in 2016 and 2015, down 10.5% and 4.1%, respectively. However, the state’s growth in construction spending ranked in the top 10 from 2008 through 2014.
West Virginia had the fourth largest decline in its real private construction spending in 2016 and 2015, down 7.5% and 3.1%, respectively. Mississippi’s 2016 decrease represents a slowdown in the decline in construction from 2014 and 2015, when private construction activity fell 8.6% and 5.6%, respectively.
Read the full report here.
Related Stories
Market Data | Jul 8, 2020
North America’s construction output to fall by 6.5% in 2020, says GlobalData
Even though all construction activities have been allowed to continue in most parts of the US and Canada since the start of the COVID-19 pandemic, many projects in the bidding or final planning stages have been delayed or canceled.
Market Data | Jul 8, 2020
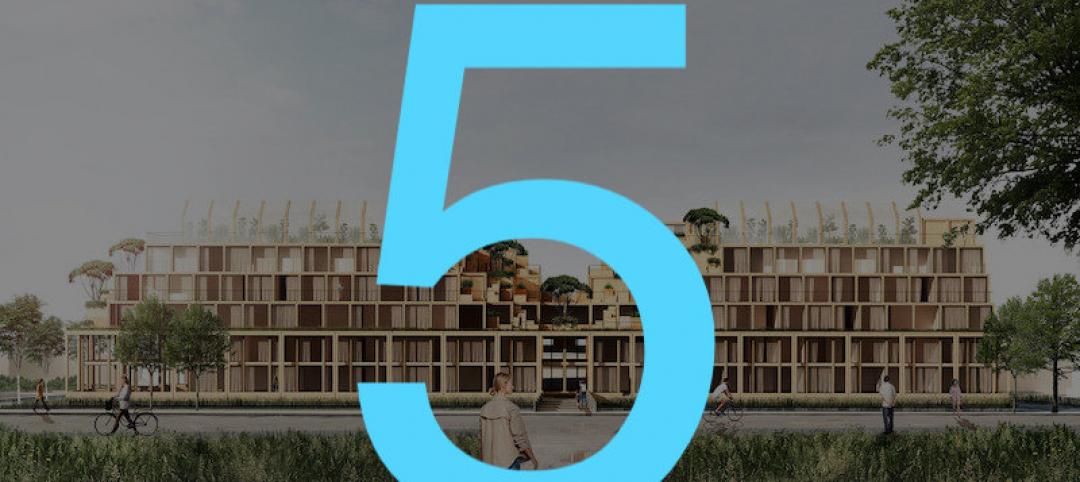
5 must reads for the AEC industry today: July 8, 2020
AEMSEN develops concept for sustainable urban living and nonresidential construction has recovered 56% of jobs lost since March.
Market Data | Jul 7, 2020
Nonresidential construction has recovered 56% of jobs lost since March employment report
Nonresidential construction employment added 74,700 jobs on net in June.

Market Data | Jul 7, 2020
7 must reads for the AEC industry today: July 7, 2020
Construction industry adds 158,000 workers in June and mall owners open micro distribution hubs for e-commerce fulfillment.

Market Data | Jul 6, 2020
Nonresidential construction spending falls modestly in May
Private nonresidential spending declined 2.4% in May and public nonresidential construction spending increased 1.2%.

Market Data | Jul 6, 2020
Construction industry adds 158,000 workers in June but infrastructure jobs decline
Gains in June are concentrated in homebuilding as state and local governments postpone or cancel roads and other projects in face of looming budget deficits.

Market Data | Jul 6, 2020
5 must reads for the AEC industry today: July 6, 2020
Demand growth for mass timber components and office demand has increased as workers return.

Market Data | Jul 2, 2020
Fall in US construction spending in May shows weakness of country’s construction industry, says GlobalData
Dariana Tani, Economist at GlobalData, a leading data and analytics company, offers her view on the situation

Market Data | Jul 2, 2020
6 must reads for the AEC industry today: July 2, 2020
Construction spending declines 2.1% in May and how physical spaces may adapt to a post-COVID world.

Market Data | Jul 1, 2020
Construction spending declines 2.1% in May as drop in private work outweighs public pickup
Federal infrastructure measure can help offset private-sector demand that is likely to remain below pre-coronavirus levels amid economic uncertainty.


