


Construction spending increased by 1.4% in August as strong gains in residential construction outweighed decreases in most private nonresidential segments and many public categories, according to an analysis by the Associated General Contractors of America of government data released today. Association officials cautioned that nonresidential construction demand will likely continue to stagnate without new federal measures to offset the economic impacts from the coronavirus.
“The August spending report shows a stark divide between housing and nonresidential markets that appears likely to widen over the coming months,” said Ken Simonson, the association’s chief economist. “With steadily rising business closures and worker layoffs, and growing budget gaps for state and local governments, project cancellations are likely to mount and new starts will dwindle.”
Construction spending in August totaled $1.41 trillion at a seasonally adjusted annual rate, an increase of 1.4% from July’s upwardly revised total. Residential spending jumped by 3.7%, while private and public nonresidential spending inched down by a combined 0.1%.
Private nonresidential construction spending contracted by 0.3% from July to August, with decreases in nine out of 11 categories. The two largest private nonresidential segments, power construction and commercial construction—comprising retail, warehouse and farm structures—each shrank by 1.1%. Among other large segments, manufacturing construction rose 2.2% and office construction slipped 0.3%.
Public construction spending edged up 0.1% in August but eight of 13 categories declined. Despite the increase in August, public construction spending has trended down by 2.5% from its high point in March.
Private residential construction spending increased by 3.7% in August, powered by a 5.5% jump in single-family homebuilding and a 3.0% gain in residential improvements. In contrast, new multifamily construction spending dipped by 0.1% from July.
Association officials noted that demand for nonresidential construction was being impacted by broader economic challenges brought about by the coronavirus. These challenges are impacting demand for many commercial projects while also impacting state and local construction budgets. The construction officials urged Congress and the White House to work together to enact new recovery measures to help boost economic activity and demand for construction.
“One of the biggest challenges facing the construction industry is the lack of demand for many new types of commercial and local infrastructure projects, especially after the current crop of projects is completed,” said Stephen E. Sandherr, the association’s chief executive officer. “Washington officials can give a needed boost to construction demand and employment by boosting infrastructure and putting in place liability protections for firms that are protecting workers from the coronavirus.”
Related Stories
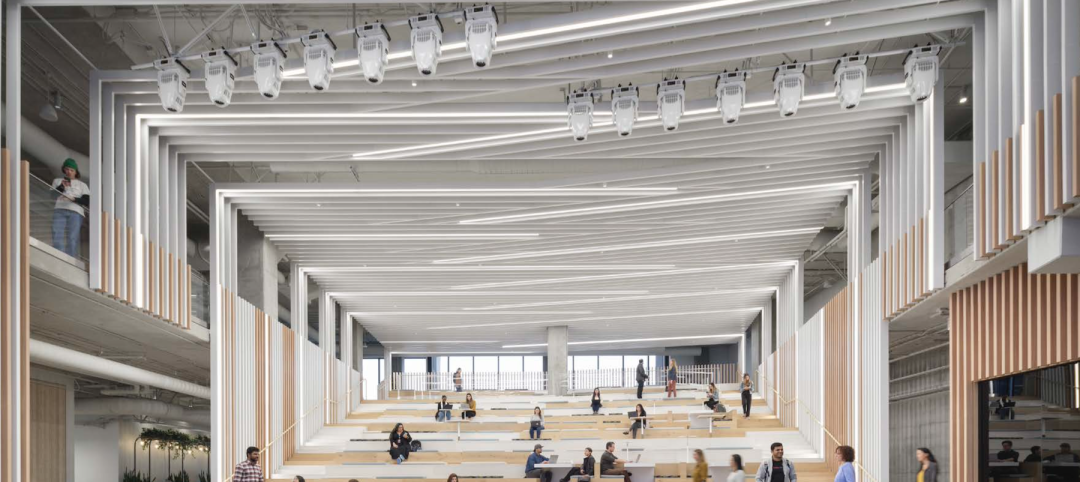
Designers | Dec 25, 2023
Redefining the workplace is a central theme in Gensler’s latest Design Report
The firm identifies eight mega trends that mostly stress human connections.

Contractors | Dec 12, 2023
The average U.S. contractor has 8.5 months worth of construction work in the pipeline, as of November 2023
Associated Builders and Contractors reported today that its Construction Backlog Indicator inched up to 8.5 months in November from 8.4 months in October, according to an ABC member survey conducted Nov. 20 to Dec. 4. The reading is down 0.7 months from November 2022.

Market Data | Nov 27, 2023
Number of employees returning to the office varies significantly by city
While the return-to-the-office trend is felt across the country, the percentage of employees moving back to their offices varies significantly according to geography, according to Eptura’s Q3 Workplace Index.

Market Data | Nov 14, 2023
The average U.S. contractor has 8.4 months worth of construction work in the pipeline, as of September 2023
Associated Builders and Contractors reported that its Construction Backlog Indicator declined to 8.4 months in October from 9.0 months in September, according to an ABC member survey conducted from Oct. 19 to Nov. 2. The reading is down 0.4 months from October 2022. Backlog now stands at its lowest level since the first quarter of 2022.

Multifamily Housing | Nov 9, 2023
Multifamily project completions forecast to slow starting 2026
Yardi Matrix has released its Q4 2023 Multifamily Supply Forecast, emphasizing a short-term spike and plateau of new construction.

Contractors | Nov 1, 2023
Nonresidential construction spending increases for the 16th straight month, in September 2023
National nonresidential construction spending increased 0.3% in September, according to an Associated Builders and Contractors analysis of data published today by the U.S. Census Bureau. On a seasonally adjusted annualized basis, nonresidential spending totaled $1.1 trillion.

Market Data | Oct 23, 2023
New data finds that the majority of renters are cost-burdened
The most recent data derived from the 2022 Census American Community Survey reveals that the proportion of American renters facing housing cost burdens has reached its highest point since 2012, undoing the progress made in the ten years leading up to the pandemic.

Contractors | Oct 19, 2023
Crane Index indicates slowing private-sector construction
Private-sector construction in major North American cities is slowing, according to the latest RLB Crane Index. The number of tower cranes in use declined 10% since the first quarter of 2023. The index, compiled by consulting firm Rider Levett Bucknall (RLB), found that only two of 14 cities—Boston and Toronto—saw increased crane counts.

Market Data | Oct 2, 2023
Nonresidential construction spending rises 0.4% in August 2023, led by manufacturing and public works sectors
National nonresidential construction spending increased 0.4% in August, according to an Associated Builders and Contractors analysis of data published today by the U.S. Census Bureau. On a seasonally adjusted annualized basis, nonresidential spending totaled $1.09 trillion.

Giants 400 | Sep 28, 2023
Top 100 University Building Construction Firms for 2023
Turner Construction, Whiting-Turner Contracting Co., STO Building Group, Suffolk Construction, and Skanska USA top BD+C's ranking of the nation's largest university sector contractors and construction management firms for 2023, as reported in Building Design+Construction's 2023 Giants 400 Report. Note: This ranking includes revenue for all university/college-related buildings except student residence halls, sports/recreation facilities, laboratories, S+T-related buildings, parking facilities, and performing arts centers (revenue for those buildings are reported in their respective Giants 400 ranking).


