


A total of 6,645 planned and ongoing construction projects by the world’s megacities, valued at US$4.2trn and fueled by the increase in population, are sparking interest in residential and infrastructural developments, according to GlobalData.
The United Nations predicts that, between 2016 and 2030, the percentage of the world's population living in cities with at least a million inhabitants is likely to grow from 23% to 27%, and the number of megacities is projected to increase from 31 to 41.
Following a recent assessment of project pipelines in major cities worldwide by GlobalData, a listing of 50 ‘Construction Mega Cities’, discovers they each have a pipeline of projects with an investment value above US$30bn.
The report states that Dubai tops the list with total project values amounting to US$374.2bn, just ahead of London in second place with US$328.7bn and Moscow in third with US$191.5bn. However, the Asia-Pacific region dominates the list, accounting for 25 of the 50 cities, and having a combined projects pipeline valued at US$1.7trn.
Yasmine Ghozzi, Economist at GlobalData, comments, “The ranking of Construction Mega Cities in the Gulf states shows they are spending the most on major development projects relative to the size of their populations. Dubai, for example, has a population of 3.2m, but it holds the top position in terms of the value of the construction mega-projects pipeline per capita.
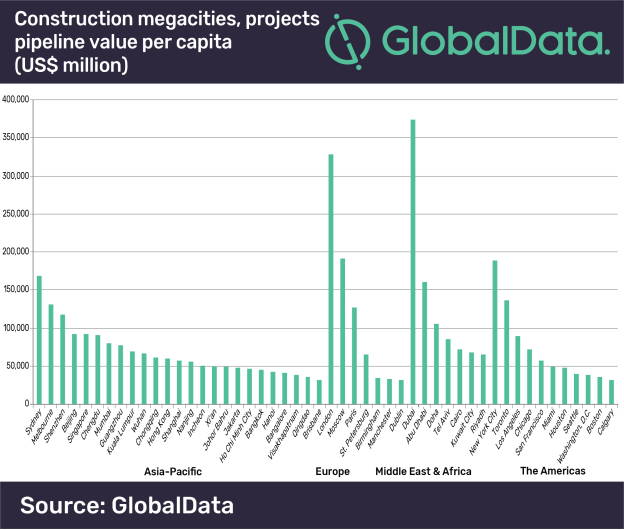
“In addition, the number of people living in Doha has increased to 1.1m as the Gulf state recruits tens of thousands of workers to work on major infrastructure projects linked to the 2022 FIFA World Cup; their project pipeline valued at US$105.6bn.”
There are major differences among the 50 Construction Mega Cities in terms of the value of the project pipelines compared to the size of the economies. Visakhapatnam, one of India's largest ports and an important industrial town and seaside resort, tops the ranking primarily owing to the government’s push on infrastructure and affordable housing.
Ghozzi continues, “The two main cities in Vietnam, Hanoi and Ho Chi Minh City, also feature in the top 10 ranking of cities in terms of the value of the project pipeline in relation to the city’s economy. Ho Chi Minh City’s economy recorded high economic growth in the first six months of 2018, with the construction industry recording growth of 7.7%. The city is expected to grow by around 8.8% a year, ahead of Hanoi (8%) and many other major cities in the region – outside of China and India – between 2018 and 2022.”
Related Stories

Market Data | Jun 23, 2020
7 must reads for the AEC industry today: June 23, 2020
Gyms are going bacnkrupt and leaving gaps in shopping centers and how hotels are trying to keep guests and employees safe.

Market Data | Jun 22, 2020
New House infrastructure package will provide needed investments in aging infrastructure, support economic recovery, and create jobs
The Moving Forward Act’s proposed $1.5 trillion in new investments will improve range of public infrastructure, creating needed demand for construction while making the economy more efficient.

Market Data | Jun 22, 2020
7 must reads for the AEC industry today: June 22, 2020
Construction employment rises from April to May in 45 states and the first building in the U.S. designed for post COVID-19 environment.
Market Data | Jun 22, 2020
Construction employment rises from April to May in 45 states, slips in 5
Rebound from April job losses reflects one-shot help from paycheck protection program loans and easing of stay-at-home orders, but cancellations and state and local deficits imply further cuts ahead.

Market Data | Jun 19, 2020
7 must reads for the AEC industry today: June 19, 2020
Brown University's first housing building in three decades and demand for family rentals expected to jump.
Market Data | Jun 18, 2020
New data shows construction activity returning to pre-coronavirus levels in many parts of the country
Association survey and data collected by Procore measure impacts of the pandemic, showing signs of a construction recovery, but labor shortages and project cancellations show industry needs federal help.

Market Data | Jun 18, 2020
AIA releases strategies and illustrations for reducing risk of COVID-19 in schools
For the 2020-21 school year, districts are facing the difficult task of determining if K-12 schools will reopen this fall.
Market Data | Jun 18, 2020
6 must reads for the AEC industry today: June 18, 2020
Northbrook's new cannabis dispensary and America's structural steel industry remains a success story.
Market Data | Jun 17, 2020
6 must reads for the AEC industry today: June 17, 2020
Santa Fe becomes the second city in the world to achieve LEED v4.1 and the megacity is dead.

Market Data | Jun 16, 2020
7 must reads for the AEC industry today: June 16, 2020
Tottenham Hotspur Stadium has its own brewery and workers want policy changes before they return to offices.


