


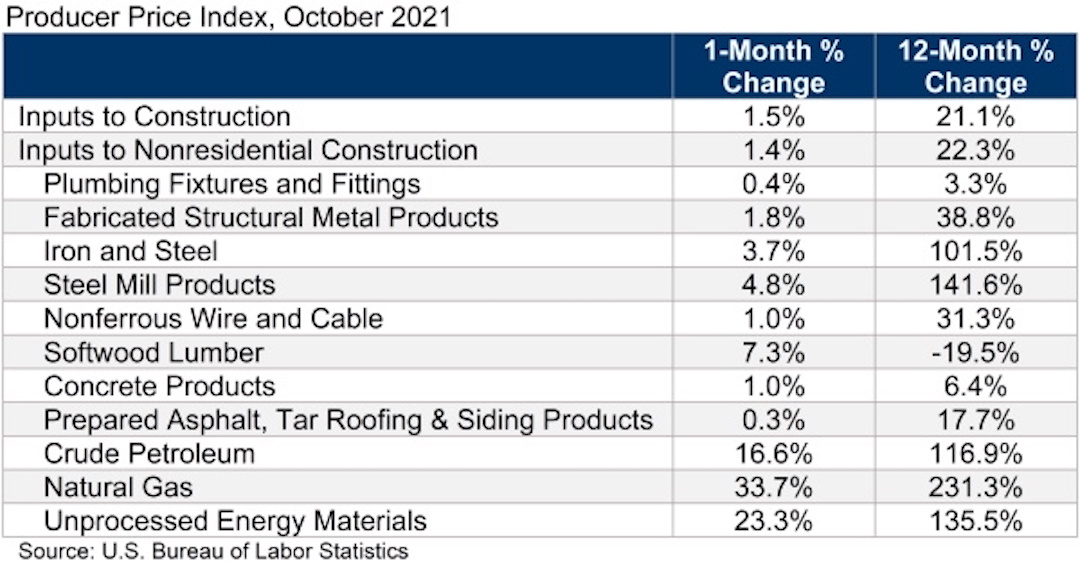
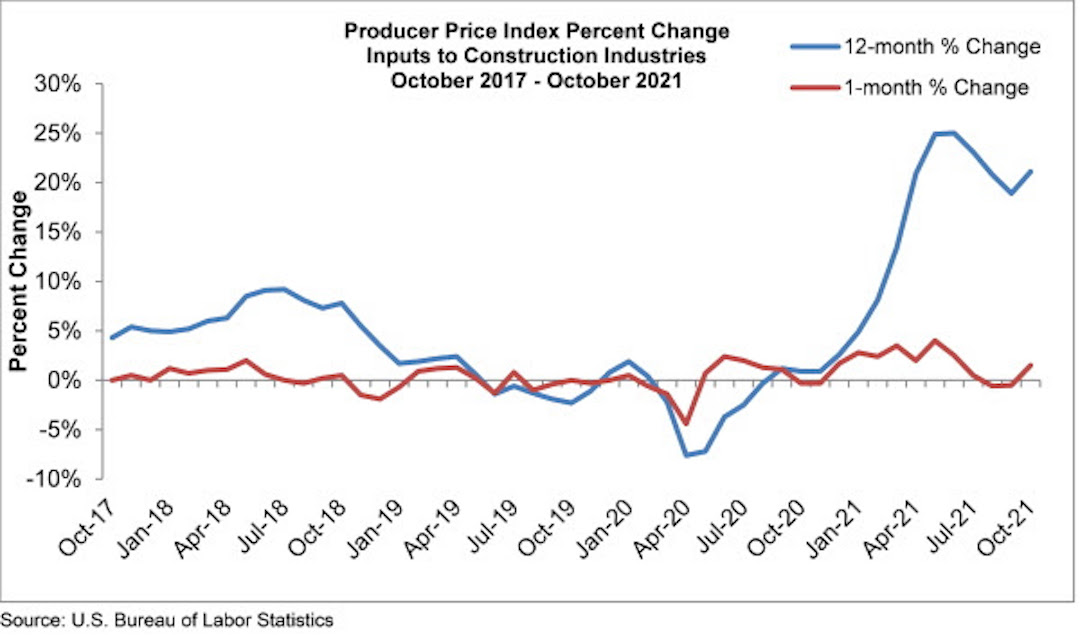
Construction input prices increased 1.5% in October, according to an Associated Builders and Contractors analysis of the U.S. Bureau of Labor Statistics’ Producer Price Index data released today. Nonresidential construction input prices increased 1.4% for the month.
Construction input prices are 21.1% higher than in October 2020, while nonresidential construction input prices increased 22.3% over that span. Steel mill product prices have increased 141.6% since October 2020, while iron and steel prices are up 101.5%. Softwood lumber prices, which surged during the pandemic, are now down 19.5% from the same time last year.
“Any notion that the bout of pandemic-induced inflation was simply transitory has gone by the wayside,” said ABC Chief Economist Anirban Basu. “Inflation continues to endure, particularly in multiple commodity categories that directly impact the cost of delivering construction services in America. These materials price increases are simply mind-boggling, with iron and steel prices up more than 100% over the past year.
“Despite increased vaccination levels, global supply chain disruptions persist,” said Basu. “Contractors should expect elevated prices well into 2022. According to ABC’s most recent Construction Confidence Index, the average contractor expects profits to decline over the next six months as the combination of high materials prices and an ongoing shortage of workers conspires to put pressure on margins."
Related Stories

Engineers | May 3, 2017
At first buoyed by Trump election, U.S. engineers now less optimistic about markets, new survey shows
The first quarter 2017 (Q1/17) of ACEC’s Engineering Business Index (EBI) dipped slightly (0.5 points) to 66.0.

Market Data | May 2, 2017
Nonresidential Spending loses steam after strong start to year
Spending in the segment totaled $708.6 billion on a seasonally adjusted, annualized basis.

Market Data | May 1, 2017
Nonresidential Fixed Investment surges despite sluggish economic in first quarter
Real gross domestic product (GDP) expanded 0.7 percent on a seasonally adjusted annualized rate during the first three months of the year.

Industry Research | Apr 28, 2017
A/E Industry lacks planning, but still spending large on hiring
The average 200-person A/E Firm is spending $200,000 on hiring, and not budgeting at all.

Market Data | Apr 19, 2017
Architecture Billings Index continues to strengthen
Balanced growth results in billings gains in all regions.

Market Data | Apr 13, 2017
2016’s top 10 states for commercial development
Three new states creep into the top 10 while first and second place remain unchanged.

Market Data | Apr 6, 2017
Architecture marketing: 5 tools to measure success
We’ve identified five architecture marketing tools that will help your firm evaluate if it’s on the track to more leads, higher growth, and broader brand visibility.

Market Data | Apr 3, 2017
Public nonresidential construction spending rebounds; overall spending unchanged in February
The segment totaled $701.9 billion on a seasonally adjusted annualized rate for the month, marking the seventh consecutive month in which nonresidential spending sat above the $700 billion threshold.

Market Data | Mar 29, 2017
Contractor confidence ends 2016 down but still in positive territory
Although all three diffusion indices in the survey fell by more than five points they remain well above the threshold of 50, which signals that construction activity will continue to be one of the few significant drivers of economic growth.

Market Data | Mar 24, 2017
These are the most and least innovative states for 2017
Connecticut, Virginia, and Maryland are all in the top 10 most innovative states, but none of them were able to claim the number one spot.


