


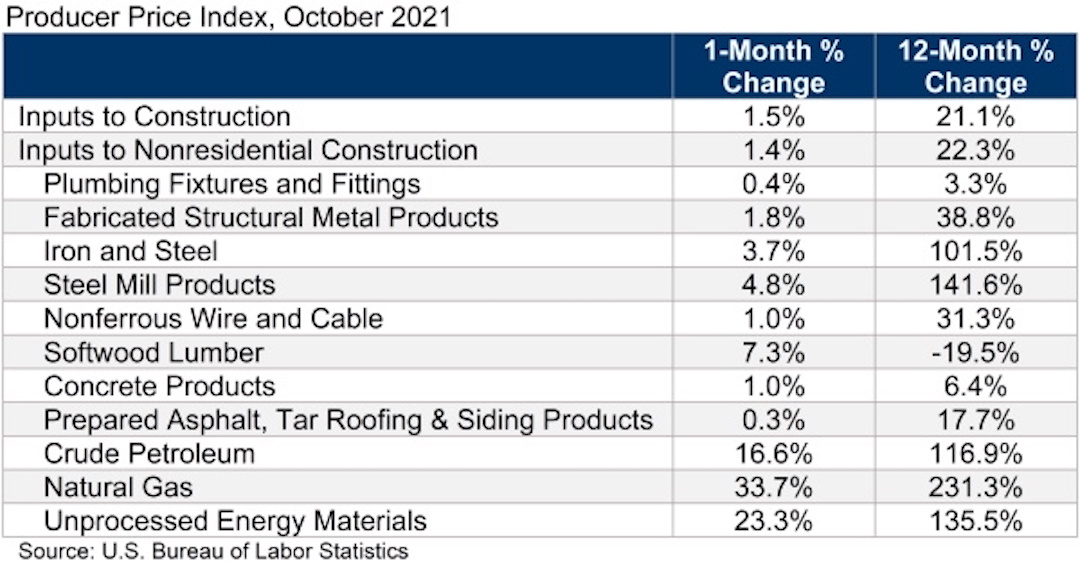
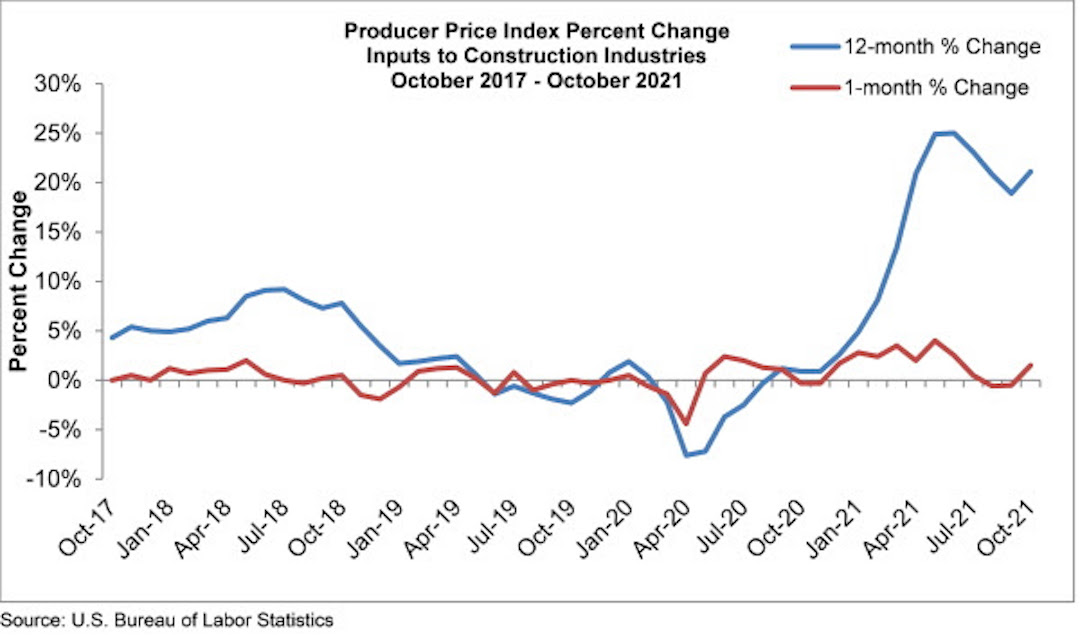
Construction input prices increased 1.5% in October, according to an Associated Builders and Contractors analysis of the U.S. Bureau of Labor Statistics’ Producer Price Index data released today. Nonresidential construction input prices increased 1.4% for the month.
Construction input prices are 21.1% higher than in October 2020, while nonresidential construction input prices increased 22.3% over that span. Steel mill product prices have increased 141.6% since October 2020, while iron and steel prices are up 101.5%. Softwood lumber prices, which surged during the pandemic, are now down 19.5% from the same time last year.
“Any notion that the bout of pandemic-induced inflation was simply transitory has gone by the wayside,” said ABC Chief Economist Anirban Basu. “Inflation continues to endure, particularly in multiple commodity categories that directly impact the cost of delivering construction services in America. These materials price increases are simply mind-boggling, with iron and steel prices up more than 100% over the past year.
“Despite increased vaccination levels, global supply chain disruptions persist,” said Basu. “Contractors should expect elevated prices well into 2022. According to ABC’s most recent Construction Confidence Index, the average contractor expects profits to decline over the next six months as the combination of high materials prices and an ongoing shortage of workers conspires to put pressure on margins."
Related Stories

Market Data | Dec 5, 2021
Nonresidential construction spending increases nearly 1% in October
Spending was up on a monthly basis in 13 of the 16 nonresidential subcategories.

Market Data | Nov 30, 2021
Two-thirds of metro areas add construction jobs from October 2020 to October 2021
The pandemic and supply chain woes may limit gains.

Market Data | Nov 22, 2021
Only 16 states and D.C. added construction jobs since the pandemic began
Texas, Wyoming have worst job losses since February 2020, while Utah, South Dakota add the most.

Market Data | Nov 9, 2021
Continued increases in construction materials prices starting to drive up price of construction projects
Supply chain and labor woes continue.

Market Data | Nov 5, 2021
Construction firms add 44,000 jobs in October
Gain occurs even as firms struggle with supply chain challenges.

Market Data | Nov 3, 2021
One-fifth of metro areas lost construction jobs between September 2020 and 2021
Beaumont-Port Arthur, Texas and Sacramento--Roseville--Arden-Arcade Calif. top lists of gainers.

Market Data | Nov 2, 2021
Construction spending slumps in September
A drop in residential work projects adds to ongoing downturn in private and public nonresidential.

Hotel Facilities | Oct 28, 2021
Marriott leads with the largest U.S. hotel construction pipeline at Q3 2021 close
In the third quarter alone, Marriott opened 60 new hotels/7,882 rooms accounting for 30% of all new hotel rooms that opened in the U.S.

Hotel Facilities | Oct 28, 2021
At the end of Q3 2021, Dallas tops the U.S. hotel construction pipeline
The top 25 U.S. markets account for 33% of all pipeline projects and 37% of all rooms in the U.S. hotel construction pipeline.

Market Data | Oct 27, 2021
Only 14 states and D.C. added construction jobs since the pandemic began
Supply problems, lack of infrastructure bill undermine recovery.


