


Forty-four states and the District of Columbia added construction jobs between October 2017 and October 2018, while 36 states and D.C. added construction jobs between September and October, according to an analysis recently released by the Associated General Contractors of America of Labor Department data. Association officials said that firms in most parts of the country are adding staff to keep pace with growing demand for construction, but cautioned that rising labor and materials costs could undermine future demand.
"Construction activity continues to expand at a steady clip, with employment growing by more than 10% during the past year in five states and by more than 5% in another 18 states," said chief economist Ken Simonson. "As contractors pay more for labor and most of the materials they use to build, construction costs will climb, potentially dampening future demand for their services."
Texas added the most construction jobs during the past year (49,900 jobs, 6.9%). Other states adding a large number of new construction jobs for the past 12 months include Florida (43,400 jobs, 8.5%), California (30,000 jobs, 3.6%), Georgia (21,600 jobs, 11.6%), Arizona (18,000 jobs, 12.1%) and New York (15,600 jobs, 4.1%). Arizona added the highest percentage of new construction jobs during the past year, followed by Georgia, Nevada (11.4%, 9,500 jobs), Oregon (10.5%, 10,400 jobs), New Hampshire (10.3%, 2,800 jobs) and Florida. Construction employment reached a record high in five states: Massachusetts, New York, Oregon, Texas and Washington.
Six states shed construction jobs between October 2017 and 2018. The largest declines and steepest percentage losses occurred in New Jersey (-3,800 jobs, -2.5%), followed by South Carolina (-1,700 jobs, -1.7%), Oklahoma (-500 jobs, -0.6%), Hawaii (-300 jobs, -0.8%) and Mississippi (-300 jobs, -0.7%).
Among the 36 states with one-month job gains between September and October, Florida (3,000 jobs, 0.5%) and California (3,000 jobs, 0.4%) had the largest gains, followed by Arizona (2,500 jobs, 1.5%), Georgia (2,500 jobs, 1.2%), Washington (2,500 jobs, 1.2%) and New York (2,500 jobs, 0.6%). Iowa added the highest percentage of construction jobs for the month (2.0%, 1,600 jobs), followed by Wyoming (1.9%, 400 jobs) and Rhode Island (1.6%, 300 jobs).
From September to October, construction employment declined in 12 states and was unchanged in Connecticut and Maine. Louisiana lost the most construction jobs (-1,900 jobs, -1.3%), followed by Oklahoma (-900 jobs, -1.2%) and Michigan (-900 jobs, -0.5%). Mississippi lost the highest percentage of construction jobs in October (-1.6%, -700 jobs), followed by Montana (-1.4%, -400 jobs), Louisiana and Oklahoma.
Association officials said widespread construction employment gains are a sign of strong demand for construction services in most parts of the country. But they cautioned that without new investments in career and technical education, immigration reform and swift resolution of trade disputes, labor and materials costs will continue to climb.
"Firms in many parts of the country are hiring as fast as they can find qualified workers to bring onboard just to keep pace with demand," said Stephen E. Sandherr, the association's chief executive officer. "But at some point, the increasing costs of labor and construction materials are going to drive construction prices to the point where many customers reschedule or rethink their projects."
View the state employment data by rank, state and peaks. View the state employment map.
Related Stories

Contractors | Jul 13, 2023
Construction input prices remain unchanged in June, inflation slowing
Construction input prices remained unchanged in June compared to the previous month, according to an Associated Builders and Contractors analysis of U.S. Bureau of Labor Statistics Producer Price Index data released today. Nonresidential construction input prices were also unchanged for the month.

Contractors | Jul 11, 2023
The average U.S. contractor has 8.9 months worth of construction work in the pipeline, as of June 2023
Associated Builders and Contractors reported that its Construction Backlog Indicator remained unchanged at 8.9 months in June 2023, according to an ABC member survey conducted June 20 to July 5. The reading is unchanged from June 2022.

Market Data | Jul 5, 2023
Nonresidential construction spending decreased in May, its first drop in nearly a year
National nonresidential construction spending decreased 0.2% in May, according to an Associated Builders and Contractors analysis of data published today by the U.S. Census Bureau. On a seasonally adjusted annualized basis, nonresidential spending totaled $1.06 trillion.

Apartments | Jun 27, 2023
Average U.S. apartment rent reached all-time high in May, at $1,716
Multifamily rents continued to increase through the first half of 2023, despite challenges for the sector and continuing economic uncertainty. But job growth has remained robust and new households keep forming, creating apartment demand and ongoing rent growth. The average U.S. apartment rent reached an all-time high of $1,716 in May.

Industry Research | Jun 15, 2023
Exurbs and emerging suburbs having fastest population growth, says Cushman & Wakefield
Recently released county and metro-level population growth data by the U.S. Census Bureau shows that the fastest growing areas are found in exurbs and emerging suburbs.

Contractors | Jun 13, 2023
The average U.S. contractor has 8.9 months worth of construction work in the pipeline, as of May 2023
Associated Builders and Contractors reported that its Construction Backlog Indicator remained unchanged at 8.9 months in May, according to an ABC member survey conducted May 20 to June 7. The reading is 0.1 months lower than in May 2022. Backlog in the infrastructure category ticked up again and has now returned to May 2022 levels. On a regional basis, backlog increased in every region but the Northeast.
Industry Research | Jun 13, 2023
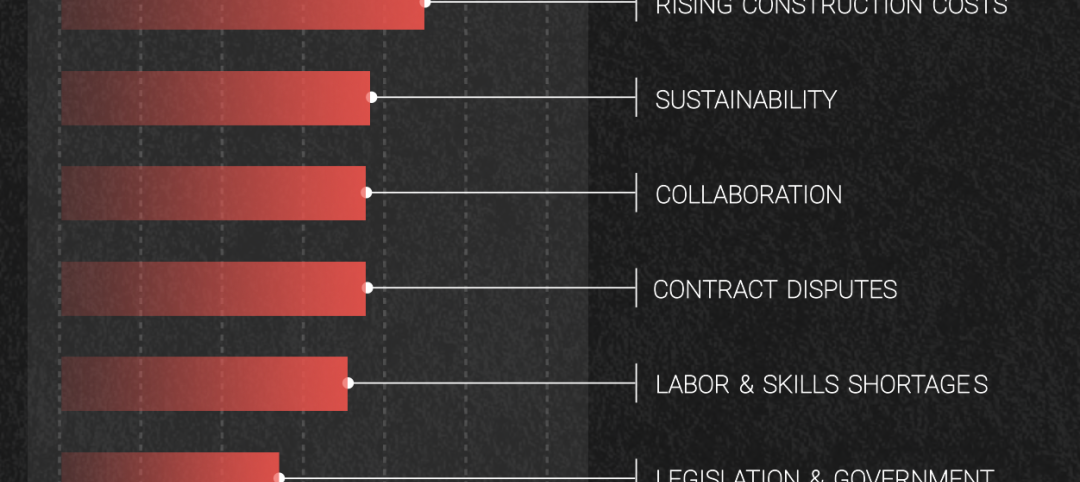
Two new surveys track how the construction industry, in the U.S. and globally, is navigating market disruption and volatility
The surveys, conducted by XYZ Reality and KPMG International, found greater willingness to embrace technology, workplace diversity, and ESG precepts.
| Jun 5, 2023
Communication is the key to AEC firms’ mental health programs and training
The core of recent awareness efforts—and their greatest challenge—is getting workers to come forward and share stories.

Contractors | May 24, 2023
The average U.S. contractor has 8.9 months worth of construction work in the pipeline, as of April 2023
Contractor backlogs climbed slightly in April, from a seven-month low the previous month, according to Associated Builders and Contractors.

Multifamily Housing | May 23, 2023
One out of three office buildings in largest U.S. cities are suitable for residential conversion
Roughly one in three office buildings in the largest U.S. cities are well suited to be converted to multifamily residential properties, according to a study by global real estate firm Avison Young. Some 6,206 buildings across 10 U.S. cities present viable opportunities for conversion to residential use.


