


Construction employment increased from May to June in 31 states and the District of Columbia, but the gains may have stalled, according to an analysis by the Associated General Contractors of America of government employment data released today and a compilation of weekly jobsite hours by construction technology firm Procore. Association officials urged officials in Washington to promptly enact funding for infrastructure projects and plug looming state and local budget deficits to head off a new round of job losses.
“The widespread job gains in June follow even more universal increases in May,” said Ken Simonson, the association’s chief economist. “But the government’s employment snapshot was based on payrolls during the week of June 12. More recent data collected by Procore on hours worked on jobsites suggests employment topped out around mid-June and may have begun to decline.”
Simonson observed that users of Procore’s software record the number of hours worked each week on their construction job sites. Procore reported that jobsite hours reached a peak of 15.1 million during the week of June 7-13. Since then, preliminary totals have slipped, to 15.0 million during the week of June 14-20 and 14.6 million during the week of June 21-27.
Procore has been mapping total jobsite hours in each state since the week of March 1, around the time of the initial restrictions on businesses in some states. Jobsite hours have increased in most states as shutdown orders were relaxed and the weather grew more favorable for construction in many locations. Nevertheless, in 12 states Procore users logged fewer jobsite hours in late June than in early March, Simonson noted.
New York added the most construction jobs from May to June (42,000 jobs or 14.2%). Massachusetts had the largest percentage increase (16.3%, 19,700 construction jobs). Construction employment declined from May to June in 18 states and was unchanged in Alaska. Louisiana lost the most construction jobs (-3,900 jobs, -3.1%). Nevada had the highest percentage loss (-3.5%, -3,500 jobs).
From June 2019 to June 2020, construction employment increased in 15 states, decreased in 34 states and D.C., and held steady in Wyoming. Utah added the most construction jobs over the year (10,200 jobs, 9.4%). South Dakota had the largest percentage increase (13.7%, 3,200 jobs). Both states set all-time highs, in records dating to 1990. New York lost the most construction jobs over the year (68,300 jobs, -16.8%). The largest percentage decline occurred in Vermont (-29.4%, -4,500 jobs).
Association officials warned that recent flare-ups of coronavirus across most states mean there will soon be more project cancellations, forcing contractors to lay off workers again. They urged Congress and the Trump administration to promptly enact new infrastructure funding measures and backfill the massive budget gaps that have opened in state and local government budgets, so that public construction does not decline precipitously.
“Only the federal government has the means to keep infrastructure and other needed public construction on track,” said Stephen E. Sandherr, the association’s chief executive officer. “It would be tragic to miss the opportunity to support the economy, keep thousands of construction employees at work, and invest in much-needed upgrades to roads, transportation facilities, water and sewer systems.”
View the state employment data, 12-mo, 1-mo rankings, map and high and lows. Click here for Procore’s data.
Related Stories

Market Data | Jun 2, 2020
Architects, health experts release strategies, tools for safely reopening buildings
AIA issues three new and enhanced tools for reducing risk of COVID-19 transmission in buildings.

Market Data | Jun 2, 2020
5 must reads for the AEC industry today: June 2, 2020
New Luxembourg office complex breaks ground and nonresidential construction spending falls.
Market Data | Jun 1, 2020
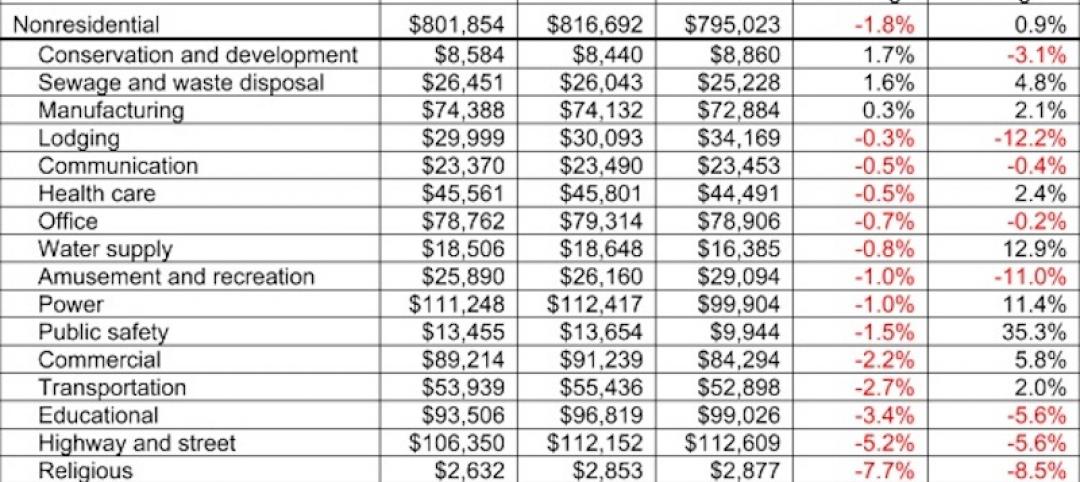
Nonresidential construction spending falls in April
Of the 16 subcategories, 13 were down on a monthly basis.
Market Data | Jun 1, 2020
7 must reads for the AEC industry today: June 1, 2020
Energy storage as an amenity and an entry-point for wellness screening everywhere.

Market Data | May 29, 2020
House-passed bill making needed improvements to paycheck protection program will allow construction firms to save more jobs
Construction official urges senate and White House to quickly pass and sign into law the Paycheck Protection Program Flexibility Act.

Market Data | May 29, 2020
7 must reads for the AEC industry today: May 29, 2020
Using lighting IoT data to inform a safer office reentry strategy and Ghafari joins forces with Eview 360.

Market Data | May 27, 2020
5 must reads for the AEC industry today: May 28, 2020
Biophilic design on the High Line and the office market could be a COVID-19 casualty.

Market Data | May 27, 2020
6 must reads for the AEC industry today: May 27, 2020
AIA's COTE Top Ten Awards and OSHA now requires employers to track COVID-19 cases.

Market Data | May 26, 2020
6 must reads for the AEC industry today: May 26, 2020
Apple's new Austin hotel and is CLT really a green solution?

Market Data | May 21, 2020
7 must reads for the AEC industry today: May 21, 2020
'Creepy' tech invades post-pandemic offices, and meet the new darling of commercial real estate.


