


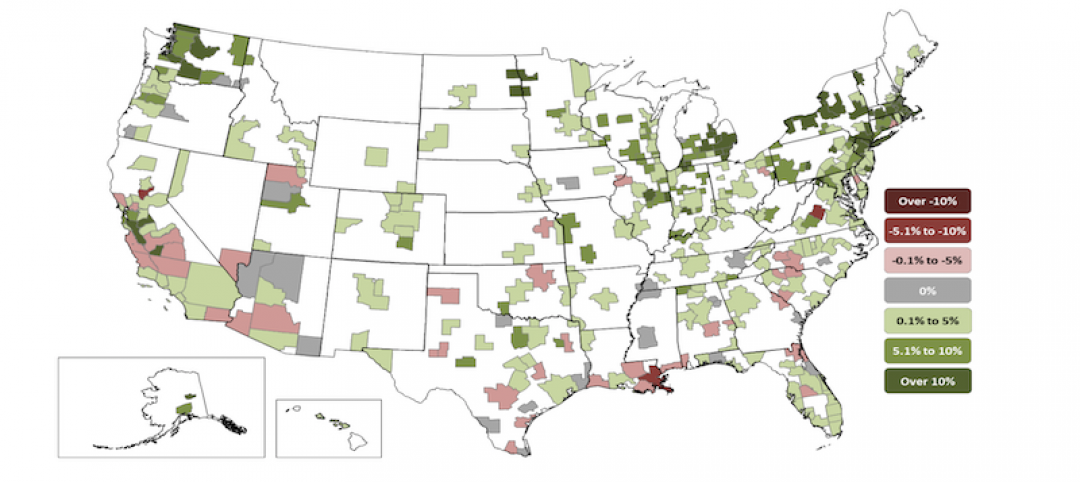
Construction employment increased in 245 out of 358 metro areas between March 2017 and March 2018, declined in 67 and stagnated in 46, according to a new analysis of federal employment data released today by the Associated General Contractors of America. Association officials said that the new figures come amid questions about how a possible trade war and long-term infrastructure funding shortfalls will impact the construction sector.
"While firms in many parts of the country continue to expand, there is a growing number of threats that could undermine future employment growth in the sector," said Stephen E. Sandherr, the association's chief executive officer. "Among the top threats to future construction growth are the risk of a trade war and long-term infrastructure funding challenges."
Houston-The Woodlands-Sugar Land, Texas added the most construction jobs during the past year (10,700 jobs, 5%), followed by Phoenix-Mesa-Scottsdale, Ariz. (9,500 jobs, 9%); Dallas-Plano-Irving, Texas (7,800 jobs, 6%) and Riverside-San Bernardino-Ontario, Calif. (7,200 jobs, 8%). The largest percentage gains occurred in the Weirton-Steubenville, W.Va.-Ohio metro area (29%, 400 jobs), followed by Merced, Calif. (26%, 600 jobs); Wenatchee, Wash. (26%, 600 jobs) and Midland, Texas (23%, 6,000 jobs).
The largest job losses from March 2017 to March 2018 were in Baton Rouge, La. (-3,200 jobs, -6%), followed by Columbia, S.C. (-2,200 jobs, -11%); Minneapolis-St. Paul-Bloomington, Minn.-Wisc. (-1,700 jobs, -2%); Newark, N.J.-Pa. (-1,700 jobs, -4%) and Montgomery County-Bucks County-Chester County, Pa. (-1,600 jobs, -3%). The largest percentage decreases for the year were in Auburn-Opelika, Ala. (-34%, -1,300 jobs), followed by Monroe, Mich. (-17%, -400 jobs); Portland-South Portland, Maine (-11%, -1,000 jobs) and Columbia, S.C. (-11%, -2,200 jobs).
Association officials said that trade disputes that could arise from the President's newly-imposed tariffs and long-term infrastructure funding shortfalls could threaten future construction employment growth. They noted that many construction firms have already experienced significant increases in what they pay for steel products. Meanwhile, long-term funding shortfalls for infrastructure improvements could undermine demand for many firms' services.
"The biggest threats to future construction growth are man-made: trade wars and funding shortfalls," said Stephen E. Sandherr, the association's chief executive officer. "Fortunately, Washington officials can help ensure future economic growth by avoiding a trade war and enacting long-term infrastructure funding."
View the metro employment data by rank and state. View metro employment map.
Related Stories
Market Data | Jul 29, 2020
62% of metros shed construction jobs from June 2019 to June 2020 as Association calls for new infrastructure funding, other relief steps
New York City and Brockton-Bridgewater-Easton, Mass. have worst 12-month losses, while Austin and Walla Walla, Wash. top job gainers.

Market Data | Jul 29, 2020
6 must reads for the AEC industry today: July 29, 2020
The world's first net-zero airport and California utility adopts climate emergency declaration.

Market Data | Jul 28, 2020
For the fourth consecutive quarter, Los Angeles leads the U.S. hotel construction pipeline at the close of Q2’ 20
New York City continues to have the greatest number of projects under construction, with 106 projects/18,354 rooms.

Market Data | Jul 28, 2020
6 must reads for the AEC industry today: July 28, 2020
St. Petersburg Pier reconstruction completes and post-pandemic workplace design will not be the same for all.

Market Data | Jul 28, 2020
Senate Republicans' coronavirus relief measure includes provisions that will help hard-hit construction firms recover
The HEALS Act includes essential liability, workforce, financial & unemployment reforms, but association will work to get needed infrastructure investments included in final relief measure.

Market Data | Jul 27, 2020
6 must reads for the AEC industry today: July 27, 2020
Customized labs give universities a recruiting edge and the U.S. construction pipeline remains robust through the first half of 2020.

Market Data | Jul 27, 2020
The U.S. construction pipeline remains robust through the first half of 2020, despite pandemic
Projects currently under construction stand at 1,771 projects/235,467 rooms, up 3% and 1% respectively, YOY.
Market Data | Jul 24, 2020
5 must reads for the AEC industry today: July 24, 2020
North Carolina will stop relying on FEMA flood mapping and Cal Poly Pomona's newest project.

Market Data | Jul 23, 2020
New LEED guidance from USGBC helps cities and communities expand resilience efforts in response to the COVID-19 pandemic
Credits integrate public health and social equity with sustainability planning.

Market Data | Jul 23, 2020
6 must reads for the AEC industry today: July 23, 2020
Skanska selects Pickard Chilton to design new ofice tower and days grow long at nursing homes as virus lockdowns drag on.


