


Construction employment in October remained depressed compared to pre-pandemic levels in three-fourths of states despite the fact 36 states and D.C. added new construction jobs in October, according to an analysis by the Associated General Contractors of America of government employment data released today. Association officials added that demand for most types of nonresidential projects remains weak amid pandemic-related uncertainty and urged federal officials to enact a new round of coronavirus recovery measures.
“An increasing number of nonresidential contractors are experiencing cancellations that are forcing them to lay off workers,” said Ken Simonson, the association’s chief economist. “Although single-family homebuilding and remodeling contractors are adding workers, most states are likely to have a net loss of construction workers soon, especially from high-paying, nonresidential jobs.”
Seasonally adjusted construction employment in October was lower than in February—the last month before the pandemic forced many contractors to suspend work—in 37 states, Simonson noted. New York lost the most construction jobs over that span (-41,600 jobs or -10.1%), closely followed by Texas (-41,500 jobs, -5.2%). Vermont had the largest percentage loss (-21.8%, -3,200 jobs), followed by North Dakota (-13.2%, -3,900 jobs).
Only thirteen states and the District of Columbia added construction jobs from February to October. Virginia added the most (7,100 jobs, 3.5%), followed by Kentucky (4,300 jobs, 5.4%) and Alabama (4,300 jobs, 4.5%). South Dakota posted the largest percentage gain (9.4%, 2,300 jobs), followed by Kentucky.
Construction employment decreased from September to October in 12 states, increased in 36 states and D.C., and was unchanged in South Dakota and Utah. Maryland shed the most construction jobs from September to October (-2,600 jobs or -1.4%), followed by Georgia (-1,800 jobs, -0.9%). Maryland also had the largest percentage decrease, followed by Delaware (-1.4%, -300 jobs).
California added the most construction jobs over the month (26,300 jobs, 3.1%), followed by Texas (9,400 jobs, 1.3%). Alaska had the largest percentage gain for the month (10.1%, 1,500 jobs), followed by Iowa (7.0%, 4,700 jobs).
Association officials urged members of Congress to craft a new series of coronavirus relief measures to help offset declining demand for most types of nonresidential construction. Those measures must include new infrastructure investments, liability reforms to protect honest firms from unwarranted pandemic lawsuits and an extension of, and new flexibility for, measures like the Paycheck Protection Program. They also urged Congress to ensure the current administration does not move forward with its plans to tax firms that used Paycheck Protection Program loans to protect essential construction jobs.
“With the pandemic raging again in most parts of the country, countless construction jobs are at risk as owners cancel or delay construction projects amid uncertainty about the future,” said Stephen E. Sandherr, the association’s chief executive officer. “Enacting needed new recovery measures now will help protect many good-paying construction careers during what will likely be a difficult winter for the economy.”
View state employment February-October data and rankings; and September-October rankings.
Related Stories

Market Data | Jun 2, 2020
Architects, health experts release strategies, tools for safely reopening buildings
AIA issues three new and enhanced tools for reducing risk of COVID-19 transmission in buildings.

Market Data | Jun 2, 2020
5 must reads for the AEC industry today: June 2, 2020
New Luxembourg office complex breaks ground and nonresidential construction spending falls.
Market Data | Jun 1, 2020
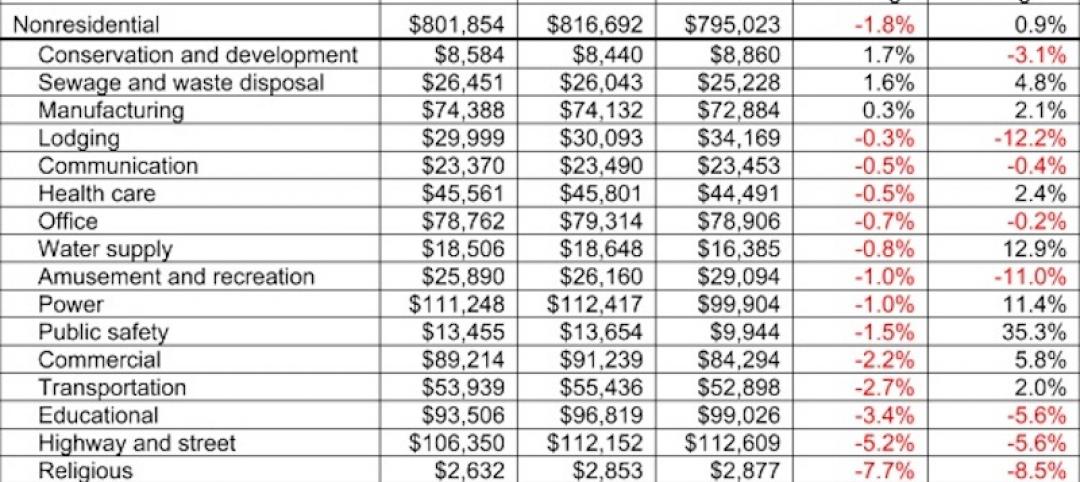
Nonresidential construction spending falls in April
Of the 16 subcategories, 13 were down on a monthly basis.
Market Data | Jun 1, 2020
7 must reads for the AEC industry today: June 1, 2020
Energy storage as an amenity and an entry-point for wellness screening everywhere.

Market Data | May 29, 2020
House-passed bill making needed improvements to paycheck protection program will allow construction firms to save more jobs
Construction official urges senate and White House to quickly pass and sign into law the Paycheck Protection Program Flexibility Act.

Market Data | May 29, 2020
7 must reads for the AEC industry today: May 29, 2020
Using lighting IoT data to inform a safer office reentry strategy and Ghafari joins forces with Eview 360.

Market Data | May 27, 2020
5 must reads for the AEC industry today: May 28, 2020
Biophilic design on the High Line and the office market could be a COVID-19 casualty.

Market Data | May 27, 2020
6 must reads for the AEC industry today: May 27, 2020
AIA's COTE Top Ten Awards and OSHA now requires employers to track COVID-19 cases.

Market Data | May 26, 2020
6 must reads for the AEC industry today: May 26, 2020
Apple's new Austin hotel and is CLT really a green solution?

Market Data | May 21, 2020
7 must reads for the AEC industry today: May 21, 2020
'Creepy' tech invades post-pandemic offices, and meet the new darling of commercial real estate.


