


Construction employment decreased from February 2020 – the last month prior to the pandemic – to April 2021 in 107, or 30%, of the nation’s metro areas, and was stagnant in another 34, according to an analysis by the Associated General Contractors of America of government employment data released today. Association officials said that construction employment in many parts of the country was being undermined by pandemic-induced project delays, materials price spikes and shortages, and difficulties finding labor.
“It is disturbing to see that nearly one-third of the nation’s metro areas had lower construction employment totals in the mild weather and strongly rebounding economy of April 2021 than in the winter of 2020,” said Ken Simonson, the association’s chief economist. “Ever-growing supply-chain bottlenecks and record prices for numerous construction materials threaten to further chill demand for job gains in many metros.”
Houston-The Woodlands-Sugar Land, Texas lost the largest number of construction jobs over the 14-month period (-29,300 jobs, -12%), followed by New York City (-22,300 jobs, -14%); Midland, Texas (-9,800 jobs, -26%); Odessa, Texas (-8,000 jobs, -39%); and Lake Charles, La. (7,200 jobs, -36%). Odessa had the largest percentage decline, followed by Lake Charles; Midland; Laredo, Texas (-23%, -7,200 jobs) and Longview, Texas (-23%, -3,400 jobs).
Construction employment was stagnant in 34 additional metro areas, while 217 metro areas—61%—added construction jobs over the pre-pandemic (February 2020) level. Indianapolis-Carmel-Anderson, Ind. added the most construction jobs over 14 months (7,900 jobs, 15%), followed by Chicago-Naperville-Arlington Heights, Ill. (6,300 jobs, 5%); Seattle-Bellevue-Everett, Wash. (6,200 jobs, 6%); Minneapolis-St. Paul-Bloomington, Minn.-Wis. (5,900 jobs, 8%); and Sacramento--Roseville--Arden-
Sierra Vista-Douglas, Ariz. had the highest percentage increase (44%, 1,100 jobs), followed by Fargo, N.D.-Minn. (34%, 2,500 jobs); Lawrence-Methuen Town Salem, Mass-N.H. (29%, 1,000 jobs); Bay City, Mich. (27%, 300 jobs) and Taunton-Middleborough-Norton, Mass. (22%, 700 jobs).
Association officials called on the Biden administration to take steps to address rising materials prices and growing labor shortages. These steps include removing tariffs on key construction materials like steel, lumber and aluminum. And they include ending unemployment insurance supplements that are providing incentives for qualified workers to stay off payrolls for now.
“Washington has put in place a number of artificial barriers that are holding back the construction industry’s recovery,” said Stephen E. Sandherr, the association’s chief executive officer. “Washington’s tariffs are making materials more expensive while its unemployment supplements are making workers more hesitant to return to payrolls.”
View the metro employment 14-month data, rankings, top 10, multi-division metros, and map.
Related Stories

Market Data | May 20, 2020
6 must reads for the AEC industry today: May 20, 2020
A wave 'inside' a South Korean building and architecture billings continues historic contraction.

Market Data | May 20, 2020
Architecture billings continue historic contraction
AIA’s Architecture Billings Index (ABI) score of 29.5 for April reflects a decrease in design services provided by U.S. architecture firms.

Market Data | May 19, 2020
5 must reads for the AEC industry today: May 19, 2020
Clemson's new mass timber building and empty hotels as an answer for the affordable housing shortage.

Market Data | May 18, 2020
5 must reads for the AEC industry today: May 18, 2020
California's grid can support all-electric buildings and you'll miss your office when it's gone.

Market Data | May 15, 2020
6 must reads for the AEC industry today: May 15, 2020
Nonresidential construction employment sees record loss and Twitter will keep all of its office space.
Market Data | May 15, 2020
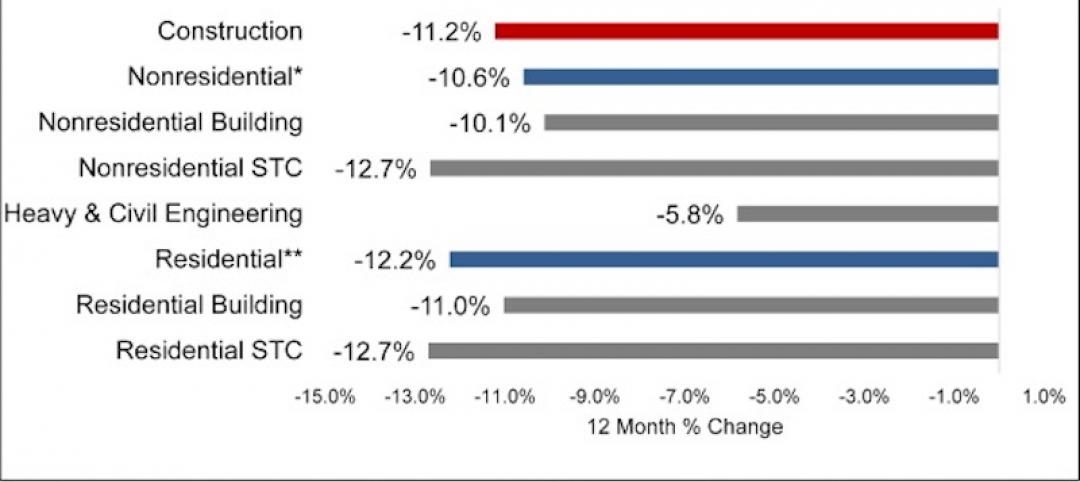
Nonresidential construction employment sees record loss in April
The construction unemployment rate was 16.6% in April, up 11.9 percentage points from the same time last year.

Market Data | May 14, 2020
5 must reads for the AEC industry today: May 14, 2020
The good news about rent might not be so good and some hotel developers consider whether to abandon projects.

Market Data | May 13, 2020
House democrats' coronavirus measure provides some relief for contractors, but lacks other steps needed to help construction
Construction official says new highway funding, employee retention credits and pension relief will help, but lack of safe harbor measure, Eextension of unemployment bonus will undermine recovery.

Market Data | May 13, 2020
5 must reads for the AEC industry today: May 13, 2020
How to design resilient libraries in a post-covid world and vacation real-estate markets are 'toast.'
Market Data | May 12, 2020
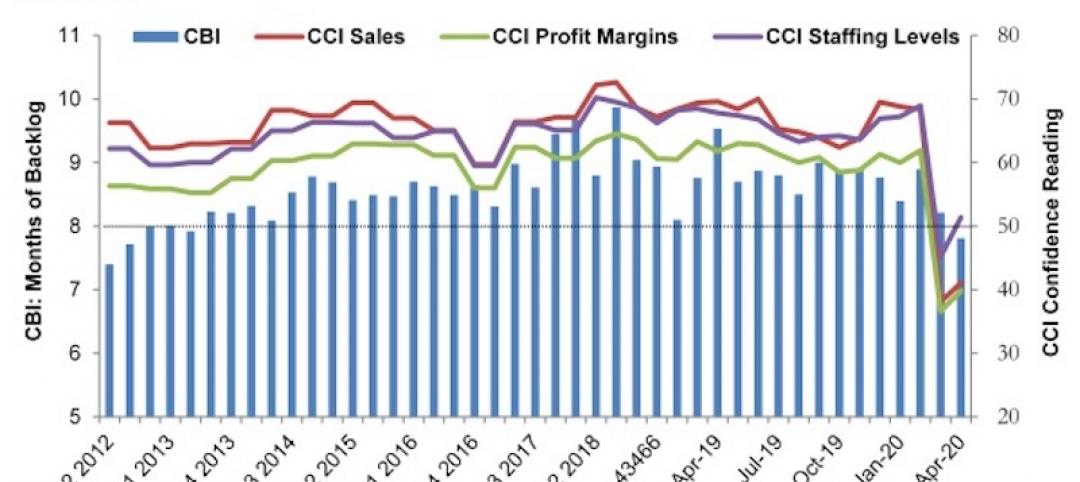
ABC’s Construction Backlog Indicator falls in April; Contractor Confidence rebounds from historic lows
Nonresidential construction backlog is down 0.4 months compared to the March 2020 ABC survey and 1.7 months from April 2019.


