


Construction employment decreased from February 2020 – the last month prior to the pandemic – to April 2021 in 107, or 30%, of the nation’s metro areas, and was stagnant in another 34, according to an analysis by the Associated General Contractors of America of government employment data released today. Association officials said that construction employment in many parts of the country was being undermined by pandemic-induced project delays, materials price spikes and shortages, and difficulties finding labor.
“It is disturbing to see that nearly one-third of the nation’s metro areas had lower construction employment totals in the mild weather and strongly rebounding economy of April 2021 than in the winter of 2020,” said Ken Simonson, the association’s chief economist. “Ever-growing supply-chain bottlenecks and record prices for numerous construction materials threaten to further chill demand for job gains in many metros.”
Houston-The Woodlands-Sugar Land, Texas lost the largest number of construction jobs over the 14-month period (-29,300 jobs, -12%), followed by New York City (-22,300 jobs, -14%); Midland, Texas (-9,800 jobs, -26%); Odessa, Texas (-8,000 jobs, -39%); and Lake Charles, La. (7,200 jobs, -36%). Odessa had the largest percentage decline, followed by Lake Charles; Midland; Laredo, Texas (-23%, -7,200 jobs) and Longview, Texas (-23%, -3,400 jobs).
Construction employment was stagnant in 34 additional metro areas, while 217 metro areas—61%—added construction jobs over the pre-pandemic (February 2020) level. Indianapolis-Carmel-Anderson, Ind. added the most construction jobs over 14 months (7,900 jobs, 15%), followed by Chicago-Naperville-Arlington Heights, Ill. (6,300 jobs, 5%); Seattle-Bellevue-Everett, Wash. (6,200 jobs, 6%); Minneapolis-St. Paul-Bloomington, Minn.-Wis. (5,900 jobs, 8%); and Sacramento--Roseville--Arden-
Sierra Vista-Douglas, Ariz. had the highest percentage increase (44%, 1,100 jobs), followed by Fargo, N.D.-Minn. (34%, 2,500 jobs); Lawrence-Methuen Town Salem, Mass-N.H. (29%, 1,000 jobs); Bay City, Mich. (27%, 300 jobs) and Taunton-Middleborough-Norton, Mass. (22%, 700 jobs).
Association officials called on the Biden administration to take steps to address rising materials prices and growing labor shortages. These steps include removing tariffs on key construction materials like steel, lumber and aluminum. And they include ending unemployment insurance supplements that are providing incentives for qualified workers to stay off payrolls for now.
“Washington has put in place a number of artificial barriers that are holding back the construction industry’s recovery,” said Stephen E. Sandherr, the association’s chief executive officer. “Washington’s tariffs are making materials more expensive while its unemployment supplements are making workers more hesitant to return to payrolls.”
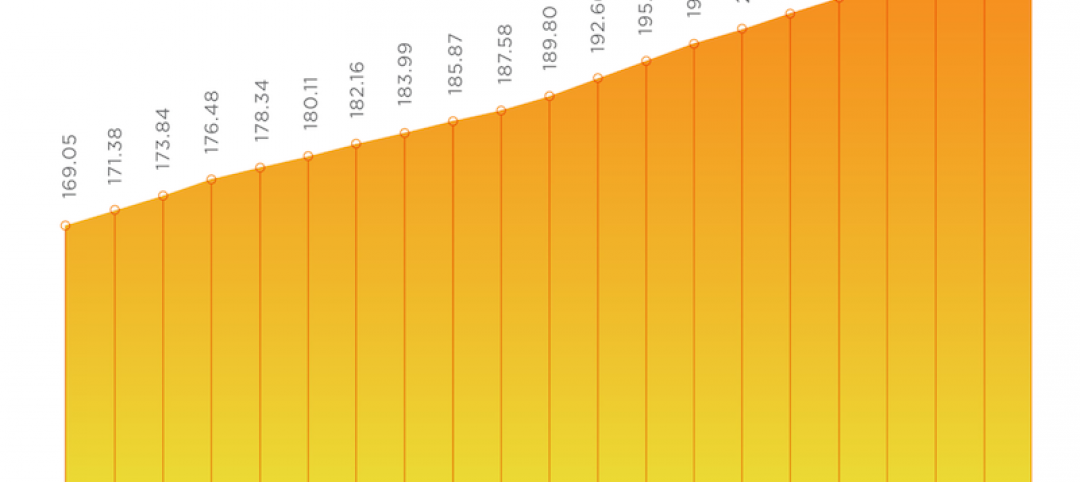
View the metro employment 14-month data, rankings, top 10, multi-division metros, and map.
Related Stories

Market Data | Jan 29, 2021
The U.S. hotel construction pipeline stands at 5,216 projects/650,222 rooms at year-end 2020
At the end of Q4 ‘20, projects currently under construction stand at 1,487 projects/199,700 rooms.

Multifamily Housing | Jan 27, 2021
2021 multifamily housing outlook: Dallas, Miami, D.C., will lead apartment completions
In its latest outlook report for the multifamily rental market, Yardi Matrix outlined several reasons for hope for a solid recovery for the multifamily housing sector in 2021, especially during the second half of the year.

Market Data | Jan 26, 2021
Construction employment in December trails pre-pandemic levels in 34 states
Texas and Vermont have worst February-December losses while Virginia and Alabama add the most.

Market Data | Jan 19, 2021
Architecture Billings continue to lose ground
The pace of decline during December accelerated from November.

Market Data | Jan 19, 2021
2021 construction forecast: Nonresidential building spending will drop 5.7%, bounce back in 2022
Healthcare and public safety are the only nonresidential construction sectors that will see growth in spending in 2021, according to AIA's 2021 Consensus Construction Forecast.

Market Data | Jan 13, 2021
Atlanta, Dallas seen as most favorable U.S. markets for commercial development in 2021, CBRE analysis finds
U.S. construction activity is expected to bounce back in 2021, after a slowdown in 2020 due to challenges brought by COVID-19.
Market Data | Jan 13, 2021
Nonres construction could be in for a long recovery period
Rider Levett Bucknall’s latest cost report singles out unemployment and infrastructure spending as barometers.

Market Data | Jan 13, 2021
Contractor optimism improves as ABC’s Construction Backlog inches up in December
ABC’s Construction Confidence Index readings for sales, profit margins, and staffing levels increased in December.

Market Data | Jan 11, 2021
Turner Construction Company launches SourceBlue Brand
SourceBlue draws upon 20 years of supply chain management experience in the construction industry.

Market Data | Jan 8, 2021
Construction sector adds 51,000 jobs in December
Gains are likely temporary as new industry survey finds widespread pessimism for 2021.


