


Toronto, Seattle, Los Angeles, and Denver top the list of U.S/Canadian cities with the greatest number of fixed construction cranes on construction sites, according to Rider Levett Bucknall's RLB Crane Index for North America for Q1 2023.
Toronto had a whopping 238 cranes in place in the first quarter. Seattle had 51 cranes to lead all U.S. cities, followed by Los Angeles (47), Denver (36), and Washington, D.C. (26).
The RLB survey reports a nominal increase of 7.04% (34 cranes) from the Q3 2022 edition of the RLB Crane Index. Of the 14 cities surveyed, eight experienced
an increase in cranes, two decreased, and four held steady.
The three top sectors across all cities are residential (51%), mixed use (22%), and commercial (12%).
"Despite continued workforce challenges and economic uncertainties are still concerns for the coming year, we are continuing to see new projects break ground within our 14-key markets. This indicates that investments are continuing to be made into our cities," said the report's authors.
"Notwithstanding concerns for the housing market, residential and mixed-use projects make up 73% of the overall count. We anticipate the number of cranes to remain high into 2023. Despite uncertain market conditions, construction projects will continue to break ground, albeit at a cost," the added.
About the RLB Crane Index
Rider Levett Bucknall’s Crane Index for North America is published biannually. It tracks the number of operating tower cranes in 14 major cities across the U.S. and Canada. The index was the first of its kind, and unlike other industry barometers that track cost and other financial data, the Crane Index tracks the number of fixed cranes on construction sites and gives a simplified measure of the current state of the construction industry’s workload in each location.
Related Stories
Apartments | Aug 22, 2023
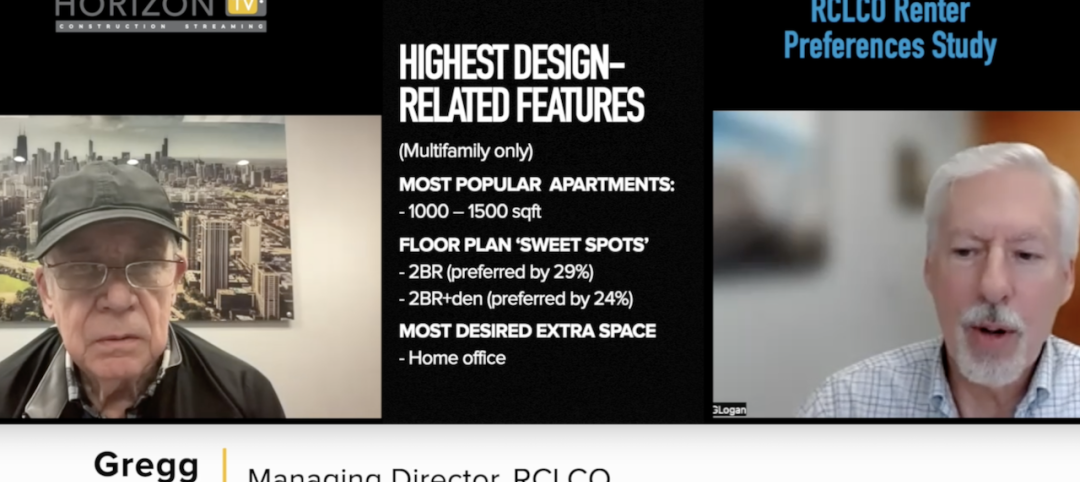
Key takeaways from RCLCO's 2023 apartment renter preferences study
Gregg Logan, Managing Director of real estate consulting firm RCLCO, reveals the highlights of RCLCO's new research study, “2023 Rental Consumer Preferences Report.” Logan speaks with BD+C's Robert Cassidy.
Market Data | Aug 18, 2023
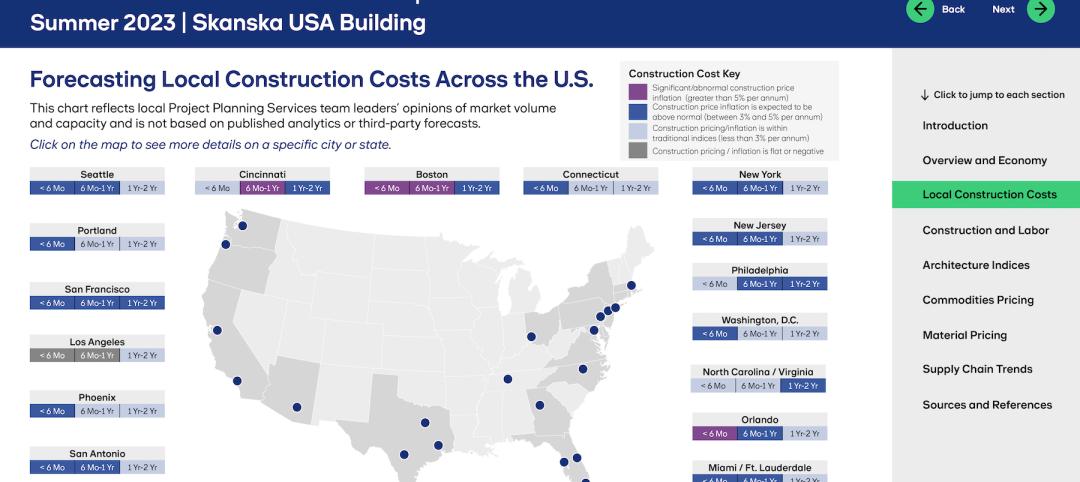
Construction soldiers on, despite rising materials and labor costs
Quarterly analyses from Skanska, Mortenson, and Gordian show nonresidential building still subject to materials and labor volatility, and regional disparities.
Apartments | Aug 14, 2023
Yardi Matrix updates near-term multifamily supply forecast
The multifamily housing supply could increase by up to nearly 7% by the end of 2023, states the latest Multifamily Supply Forecast from Yardi Matrix.

Hotel Facilities | Aug 2, 2023
Top 5 markets for hotel construction
According to the United States Construction Pipeline Trend Report by Lodging Econometrics (LE) for Q2 2023, the five markets with the largest hotel construction pipelines are Dallas with a record-high 184 projects/21,501 rooms, Atlanta with 141 projects/17,993 rooms, Phoenix with 119 projects/16,107 rooms, Nashville with 116 projects/15,346 rooms, and Los Angeles with 112 projects/17,797 rooms.

Market Data | Aug 1, 2023
Nonresidential construction spending increases slightly in June
National nonresidential construction spending increased 0.1% in June, according to an Associated Builders and Contractors analysis of data published today by the U.S. Census Bureau. Spending is up 18% over the past 12 months. On a seasonally adjusted annualized basis, nonresidential spending totaled $1.07 trillion in June.

Hotel Facilities | Jul 27, 2023
U.S. hotel construction pipeline remains steady with 5,572 projects in the works
The hotel construction pipeline grew incrementally in Q2 2023 as developers and franchise companies push through short-term challenges while envisioning long-term prospects, according to Lodging Econometrics.

Hotel Facilities | Jul 26, 2023
Hospitality building construction costs for 2023
Data from Gordian breaks down the average cost per square foot for 15-story hotels, restaurants, fast food restaurants, and movie theaters across 10 U.S. cities: Boston, Chicago, Las Vegas, Los Angeles, Miami, New Orleans, New York, Phoenix, Seattle, and Washington, D.C.

Market Data | Jul 24, 2023
Leading economists call for 2% increase in building construction spending in 2024
Following a 19.7% surge in spending for commercial, institutional, and industrial buildings in 2023, leading construction industry economists expect spending growth to come back to earth in 2024, according to the July 2023 AIA Consensus Construction Forecast Panel.

Contractors | Jul 13, 2023
Construction input prices remain unchanged in June, inflation slowing
Construction input prices remained unchanged in June compared to the previous month, according to an Associated Builders and Contractors analysis of U.S. Bureau of Labor Statistics Producer Price Index data released today. Nonresidential construction input prices were also unchanged for the month.

Contractors | Jul 11, 2023
The average U.S. contractor has 8.9 months worth of construction work in the pipeline, as of June 2023
Associated Builders and Contractors reported that its Construction Backlog Indicator remained unchanged at 8.9 months in June 2023, according to an ABC member survey conducted June 20 to July 5. The reading is unchanged from June 2022.


