


Construction costs nationally rose in 2018 by an average of 5.73%, with Chicago and Portland, Ore., showing the greatest increases among major cities.
Costs rose at a time when many markets are at or near their construction-activity cycle, and as industry unemployment remained higher than the country’s at large.
Those are two findings in the latest Quarterly Construction Cost Report for North America, released by the property and construction consultant Rider Levett Bucknall (RLB), and based on an analysis of 15 building typologies in 14 metros. (The sectors analyzed include single- and multifamily housing, as well as parking structures.)
The full quarterly report can be accessed here.
The U.S. Department of Commerce estimates that, as of January 2019, the seasonally adjusted annual rate for Construction Put-in-Place was just under $1.28 trillion, 0.3% above the same monthly estimate a year earlier.
However, the National Construction Cost Index has been on a fairly steady upward trajectory since the first quarter of 2014. As of the first quarter of 2019, that Index stood at 198.33 (relative to the April 2001 base of 100, recalibrated as of April 2011).
Some examples of RLB’s findings include its estimate that the cost of building prime office space is highest in Boston and New York, lowest in Phoenix and Denver. Los Angeles has the highest construction costs for hospitals, and Las Vegas the lowest for elementary schools.
Eight of the 14 markets analyzed were at their construction-activity peaks by the end of last year. Chicago’s construction costs, in general, increased the most (7.61%, to $22.8 billion) among the metros analyzed, even though it was the only city that fell into the “mid decline” category for construction activity. Honolulu, the only city in “trough growth,” saw construction costs rise by 4.86% to $24.8 billion.
 Eight of the 14 metros tracked are at the top of their constuction cycles. Image: RLB
San Francisco had the highest construction put-in-place, $26.844 billion, up 6.73%.
Increasingly expensive construction activity occurred despite a decrease in architectural billings, and an industry unemployment rate that, at 5.1% in the fourth quarter of last year, was down from 7.4% in the first quarter of 2018.
The U.S. Gross Domestic Product closed out the fourth quarter at 2.6%, down from a mid-year peak of 4.2%. Inflation last year was up only 1.91%.
The report also analyzes construction costs in Canada, specifically Calgary, Alberta, and Toronto, Ontario. RLB notes that those two cities are driving much of the growth in Canada’s economy.
Related Stories

Industry Research | Oct 3, 2016
Structure Tone survey shows cost is still a major barrier to building green
Climate change, resilience and wellness are also growing concerns.

Industry Research | Sep 27, 2016
Sterling Risk Sentiment Index indicates risk exposure perception remains stable in construction industry
Nearly half (45%) of those polled say election year uncertainty has a negative effect on risk perception in the construction market.

Market Data | Sep 22, 2016
Architecture Billings Index slips, overall outlook remains positive
Business conditions are slumping in the Northeast.

Market Data | Sep 20, 2016
Backlog skyrockets for largest firms during second quarter, but falls to 8.5 months overall
While a handful of commercial construction segments continue to be associated with expanding volumes, for the most part, the average contractor is no longer getting busier, says ABC Chief Economist Anirban Basu.
Designers | Sep 13, 2016
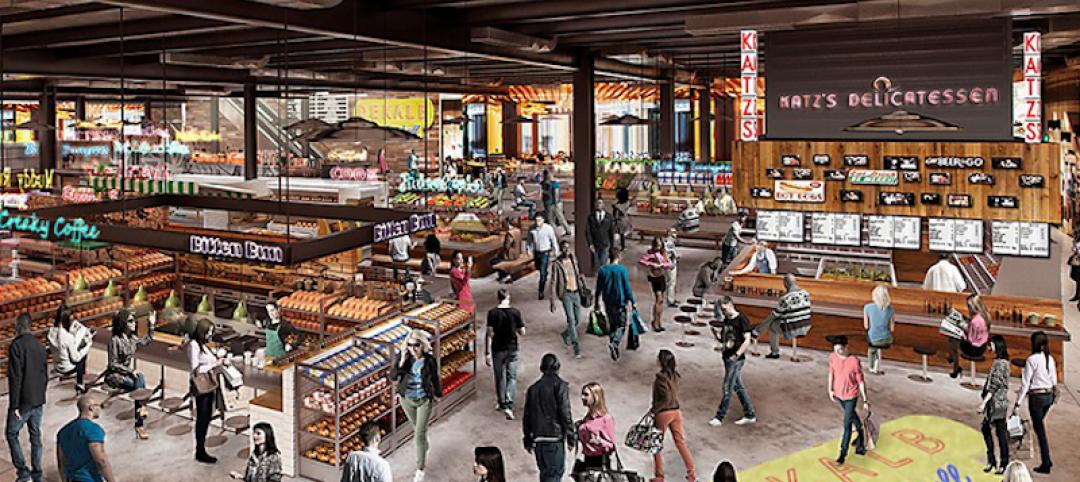
5 trends propelling a new era of food halls
Food halls have not only become an economical solution for restauranteurs and chefs experiencing skyrocketing retail prices and rents in large cities, but they also tap into our increased interest in gourmet locally sourced food, writes Gensler's Toshi Kasai.
Building Team | Sep 6, 2016
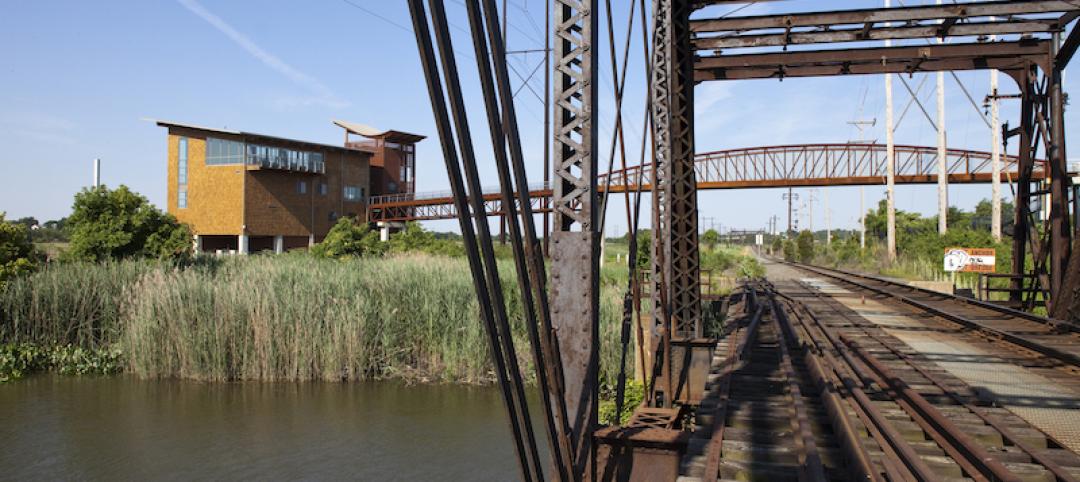
Letting your resource take center stage: A guide to thoughtful site selection for interpretive centers
Thoughtful site selection is never about one factor, but rather a confluence of several components that ultimately present trade-offs for the owner.

Market Data | Sep 2, 2016
Nonresidential spending inches lower in July while June data is upwardly revised to eight-year record
Nonresidential construction spending has been suppressed over the last year or so with the primary factor being the lack of momentum in public spending.

Industry Research | Sep 1, 2016
CannonDesign releases infographic to better help universities obtain more R&D funding
CannonDesign releases infographic to better help universities obtain more R&D funding.

Industry Research | Aug 25, 2016
Building bonds: The role of 'trusted advisor' is earned not acquired
A trusted advisor acts as a guiding partner over the full course of a professional relationship.

Multifamily Housing | Aug 17, 2016
A new research platform launches for a data-deprived multifamily sector
The list of leading developers, owners, and property managers that are funding the NMHC Research Foundation speaks to the information gap it hopes to fill.


