


Construction costs nationally rose in 2018 by an average of 5.73%, with Chicago and Portland, Ore., showing the greatest increases among major cities.
Costs rose at a time when many markets are at or near their construction-activity cycle, and as industry unemployment remained higher than the country’s at large.
Those are two findings in the latest Quarterly Construction Cost Report for North America, released by the property and construction consultant Rider Levett Bucknall (RLB), and based on an analysis of 15 building typologies in 14 metros. (The sectors analyzed include single- and multifamily housing, as well as parking structures.)
The full quarterly report can be accessed here.
The U.S. Department of Commerce estimates that, as of January 2019, the seasonally adjusted annual rate for Construction Put-in-Place was just under $1.28 trillion, 0.3% above the same monthly estimate a year earlier.
However, the National Construction Cost Index has been on a fairly steady upward trajectory since the first quarter of 2014. As of the first quarter of 2019, that Index stood at 198.33 (relative to the April 2001 base of 100, recalibrated as of April 2011).
Some examples of RLB’s findings include its estimate that the cost of building prime office space is highest in Boston and New York, lowest in Phoenix and Denver. Los Angeles has the highest construction costs for hospitals, and Las Vegas the lowest for elementary schools.
Eight of the 14 markets analyzed were at their construction-activity peaks by the end of last year. Chicago’s construction costs, in general, increased the most (7.61%, to $22.8 billion) among the metros analyzed, even though it was the only city that fell into the “mid decline” category for construction activity. Honolulu, the only city in “trough growth,” saw construction costs rise by 4.86% to $24.8 billion.
 Eight of the 14 metros tracked are at the top of their constuction cycles. Image: RLB
San Francisco had the highest construction put-in-place, $26.844 billion, up 6.73%.
Increasingly expensive construction activity occurred despite a decrease in architectural billings, and an industry unemployment rate that, at 5.1% in the fourth quarter of last year, was down from 7.4% in the first quarter of 2018.
The U.S. Gross Domestic Product closed out the fourth quarter at 2.6%, down from a mid-year peak of 4.2%. Inflation last year was up only 1.91%.
The report also analyzes construction costs in Canada, specifically Calgary, Alberta, and Toronto, Ontario. RLB notes that those two cities are driving much of the growth in Canada’s economy.
Related Stories

Market Data | Apr 23, 2020
Construction Contractor Confidence plummets in February
As of February 2020, fewer than 30% of contractors expected their sales to increase over the next six months.

Market Data | Apr 23, 2020
5 must reads for the AEC industry today: April 23, 2020
The death of the department store and how to return to work when the time comes.
Market Data | Apr 22, 2020
6 must reads for the AEC industry today: April 22, 2020
Repurposed containers can be used as rapid response airborne infection isolation rooms and virtual site visits help control infection on project sites.
Market Data | Apr 21, 2020
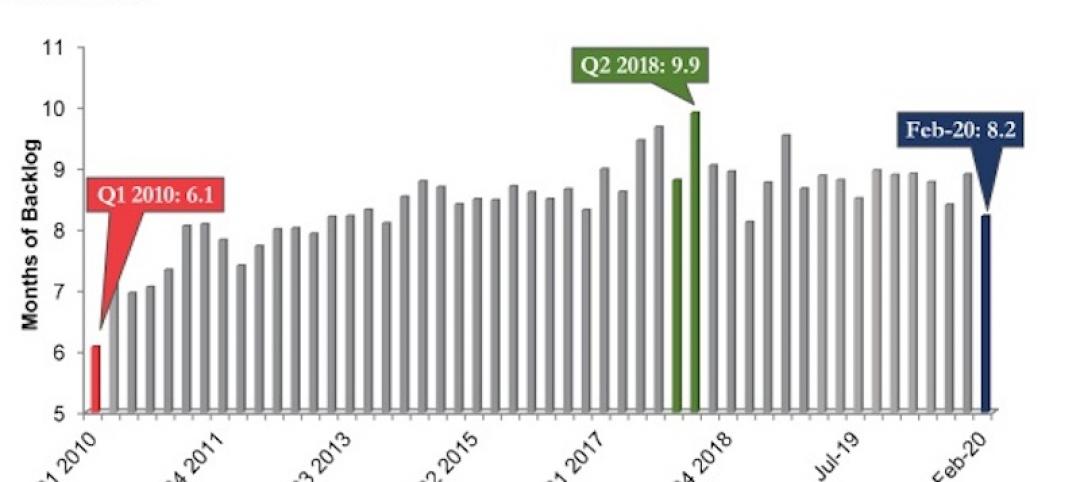
ABC's Construction Backlog Indicator down in February
Backlog for firms working in the infrastructure segment rose by 1.3 months in February while backlog for commercial and institutional and heavy industrial firms declined by 0.6 months and 0.7 months, respectively.

Market Data | Apr 21, 2020
5 must reads for the AEC industry today: April 21, 2020
IoT system helps contractors keep their distance and the multifamily market flattens.

Market Data | Apr 20, 2020
6 must reads for the AEC industry today: April 20, 2020
The continent's tallest living wall and NMHC survey shows significant delays in apartment construction.

Market Data | Apr 17, 2020
Construction employment declines in 20 states and D.C. in March, in line with industry survey showing growing job losses for the sector
New monthly job loss data foreshadows more layoffs amid project cancellations and state cutbacks in road projects as association calls for more small business relief and immediate aid for highway funding.

Market Data | Apr 17, 2020
5 must reads for the AEC industry today: April 17, 2020
Meet the 'AEC outsiders' pushing the industry forward and the world's largest Living Building.

Market Data | Apr 16, 2020
5 must reads for the AEC industry today: April 16, 2020
The SMPS Foundation and Building Design+Construction are studying the impact of the coronavirus pandemic on the ability to attain and retain clients and conduct projects and Saks Fifth Avenue plans a sanitized post-coronavirus opening.

Market Data | Apr 15, 2020
5 must reads for the AEC industry today: April 15, 2020
Buildings as "open source platforms" and 3D printing finds its grove producing face shields.


