


Construction costs nationally rose in 2018 by an average of 5.73%, with Chicago and Portland, Ore., showing the greatest increases among major cities.
Costs rose at a time when many markets are at or near their construction-activity cycle, and as industry unemployment remained higher than the country’s at large.
Those are two findings in the latest Quarterly Construction Cost Report for North America, released by the property and construction consultant Rider Levett Bucknall (RLB), and based on an analysis of 15 building typologies in 14 metros. (The sectors analyzed include single- and multifamily housing, as well as parking structures.)
The full quarterly report can be accessed here.
The U.S. Department of Commerce estimates that, as of January 2019, the seasonally adjusted annual rate for Construction Put-in-Place was just under $1.28 trillion, 0.3% above the same monthly estimate a year earlier.
However, the National Construction Cost Index has been on a fairly steady upward trajectory since the first quarter of 2014. As of the first quarter of 2019, that Index stood at 198.33 (relative to the April 2001 base of 100, recalibrated as of April 2011).
Some examples of RLB’s findings include its estimate that the cost of building prime office space is highest in Boston and New York, lowest in Phoenix and Denver. Los Angeles has the highest construction costs for hospitals, and Las Vegas the lowest for elementary schools.
Eight of the 14 markets analyzed were at their construction-activity peaks by the end of last year. Chicago’s construction costs, in general, increased the most (7.61%, to $22.8 billion) among the metros analyzed, even though it was the only city that fell into the “mid decline” category for construction activity. Honolulu, the only city in “trough growth,” saw construction costs rise by 4.86% to $24.8 billion.
 Eight of the 14 metros tracked are at the top of their constuction cycles. Image: RLB
San Francisco had the highest construction put-in-place, $26.844 billion, up 6.73%.
Increasingly expensive construction activity occurred despite a decrease in architectural billings, and an industry unemployment rate that, at 5.1% in the fourth quarter of last year, was down from 7.4% in the first quarter of 2018.
The U.S. Gross Domestic Product closed out the fourth quarter at 2.6%, down from a mid-year peak of 4.2%. Inflation last year was up only 1.91%.
The report also analyzes construction costs in Canada, specifically Calgary, Alberta, and Toronto, Ontario. RLB notes that those two cities are driving much of the growth in Canada’s economy.
Related Stories

Market Data | Jun 9, 2020
ABC’s Construction Backlog Indicator inches higher in May; Contractor confidence continues to rebound
Nonresidential construction backlog is down 0.8 months compared to May 2019 and declined year over year in every industry.

Market Data | Jun 9, 2020
6 must reads for the AEC industry today: June 9, 2020
OSHA safety inspections fall 84% and the office isn't dead.

Market Data | Jun 8, 2020
Construction jobs rise by 464,000 jobs but remain 596,000 below recent peak
Gains in may reflect temporary support from paycheck protection program loans and easing of construction restrictions, but hobbled economy and tight state and local budgets risk future job losses.

Market Data | Jun 5, 2020
7 must reads for the AEC industry today: June 5, 2020
The world's first carbon-fiber reinforced concrete building and what will college be like in the fall?

Market Data | Jun 4, 2020
7 must reads for the AEC industry today: June 4, 2020
Construction unemployment declines in 326 of 358 metro areas and is the show over for AMC Theatres?

Market Data | Jun 3, 2020
Construction employment declines in 326 out of 358 metro areas in April
Association says new transportation proposal could help restore jobs.

Market Data | Jun 3, 2020
6 must reads for the AEC industry today: June 3, 2020
5 ways to improve cleanliness of public restrooms and office owners are in no hurry for tenants to return.

Market Data | Jun 2, 2020
Architects, health experts release strategies, tools for safely reopening buildings
AIA issues three new and enhanced tools for reducing risk of COVID-19 transmission in buildings.

Market Data | Jun 2, 2020
5 must reads for the AEC industry today: June 2, 2020
New Luxembourg office complex breaks ground and nonresidential construction spending falls.
Market Data | Jun 1, 2020
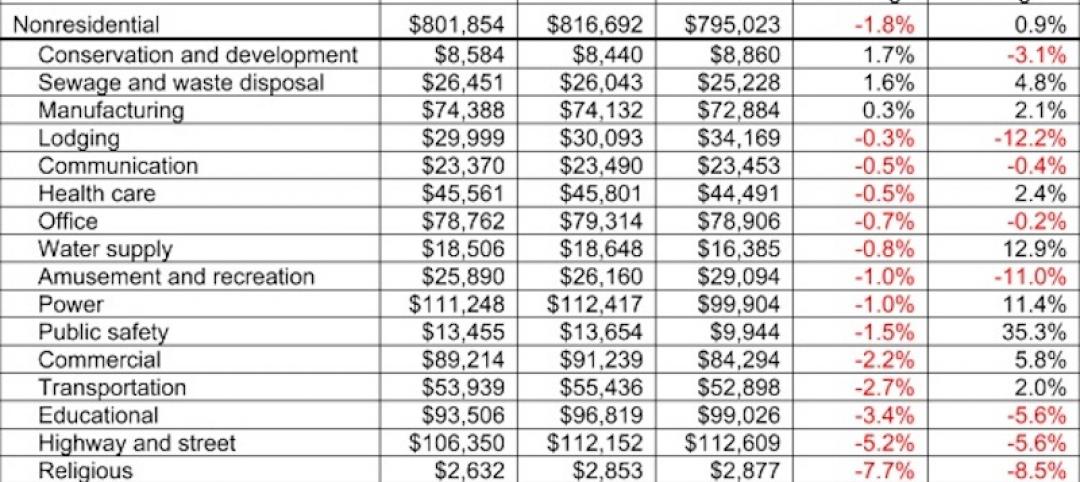
Nonresidential construction spending falls in April
Of the 16 subcategories, 13 were down on a monthly basis.


