


Construction costs nationally rose in 2018 by an average of 5.73%, with Chicago and Portland, Ore., showing the greatest increases among major cities.
Costs rose at a time when many markets are at or near their construction-activity cycle, and as industry unemployment remained higher than the country’s at large.
Those are two findings in the latest Quarterly Construction Cost Report for North America, released by the property and construction consultant Rider Levett Bucknall (RLB), and based on an analysis of 15 building typologies in 14 metros. (The sectors analyzed include single- and multifamily housing, as well as parking structures.)
The full quarterly report can be accessed here.
The U.S. Department of Commerce estimates that, as of January 2019, the seasonally adjusted annual rate for Construction Put-in-Place was just under $1.28 trillion, 0.3% above the same monthly estimate a year earlier.
However, the National Construction Cost Index has been on a fairly steady upward trajectory since the first quarter of 2014. As of the first quarter of 2019, that Index stood at 198.33 (relative to the April 2001 base of 100, recalibrated as of April 2011).
Some examples of RLB’s findings include its estimate that the cost of building prime office space is highest in Boston and New York, lowest in Phoenix and Denver. Los Angeles has the highest construction costs for hospitals, and Las Vegas the lowest for elementary schools.
Eight of the 14 markets analyzed were at their construction-activity peaks by the end of last year. Chicago’s construction costs, in general, increased the most (7.61%, to $22.8 billion) among the metros analyzed, even though it was the only city that fell into the “mid decline” category for construction activity. Honolulu, the only city in “trough growth,” saw construction costs rise by 4.86% to $24.8 billion.
 Eight of the 14 metros tracked are at the top of their constuction cycles. Image: RLB
San Francisco had the highest construction put-in-place, $26.844 billion, up 6.73%.
Increasingly expensive construction activity occurred despite a decrease in architectural billings, and an industry unemployment rate that, at 5.1% in the fourth quarter of last year, was down from 7.4% in the first quarter of 2018.
The U.S. Gross Domestic Product closed out the fourth quarter at 2.6%, down from a mid-year peak of 4.2%. Inflation last year was up only 1.91%.
The report also analyzes construction costs in Canada, specifically Calgary, Alberta, and Toronto, Ontario. RLB notes that those two cities are driving much of the growth in Canada’s economy.
Related Stories

Market Data | May 20, 2020
Architecture billings continue historic contraction
AIA’s Architecture Billings Index (ABI) score of 29.5 for April reflects a decrease in design services provided by U.S. architecture firms.

Market Data | May 19, 2020
5 must reads for the AEC industry today: May 19, 2020
Clemson's new mass timber building and empty hotels as an answer for the affordable housing shortage.

Market Data | May 18, 2020
5 must reads for the AEC industry today: May 18, 2020
California's grid can support all-electric buildings and you'll miss your office when it's gone.

Market Data | May 15, 2020
6 must reads for the AEC industry today: May 15, 2020
Nonresidential construction employment sees record loss and Twitter will keep all of its office space.
Market Data | May 15, 2020
Nonresidential construction employment sees record loss in April
The construction unemployment rate was 16.6% in April, up 11.9 percentage points from the same time last year.
Market Data | May 14, 2020
5 must reads for the AEC industry today: May 14, 2020
The good news about rent might not be so good and some hotel developers consider whether to abandon projects.

Market Data | May 13, 2020
House democrats' coronavirus measure provides some relief for contractors, but lacks other steps needed to help construction
Construction official says new highway funding, employee retention credits and pension relief will help, but lack of safe harbor measure, Eextension of unemployment bonus will undermine recovery.

Market Data | May 13, 2020
5 must reads for the AEC industry today: May 13, 2020
How to design resilient libraries in a post-covid world and vacation real-estate markets are 'toast.'
Market Data | May 12, 2020
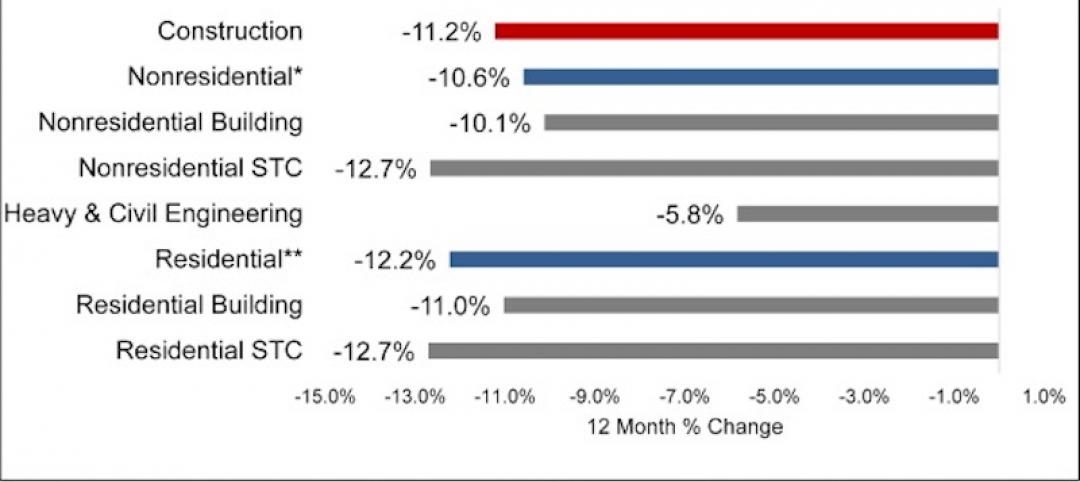
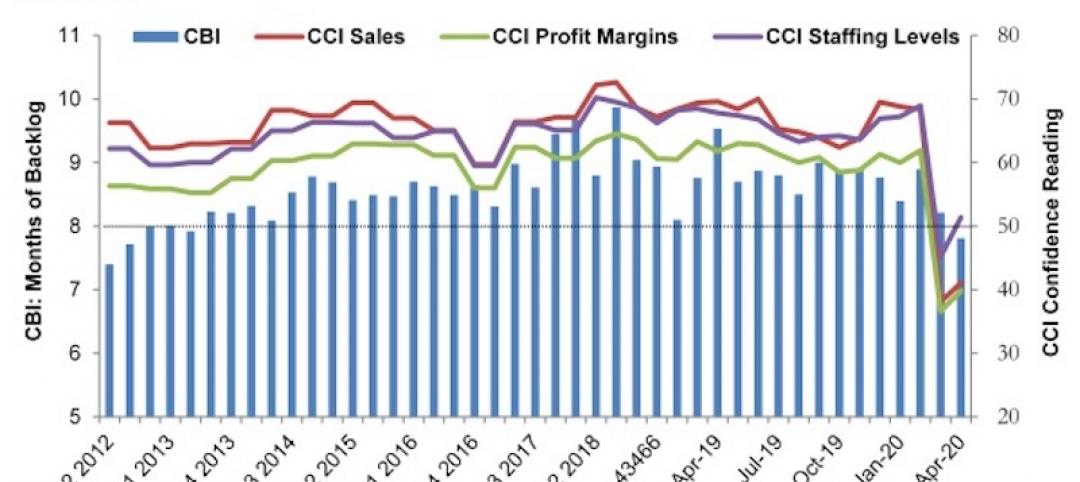
ABC’s Construction Backlog Indicator falls in April; Contractor Confidence rebounds from historic lows
Nonresidential construction backlog is down 0.4 months compared to the March 2020 ABC survey and 1.7 months from April 2019.

Market Data | May 12, 2020
6 must reads for the AEC industry today: May 12, 2020
A 13-point plan to reduce coronavirus deaths in nursing homes and Bjarke Ingels discusses building on Mars.


