


Through April of this year, the national average increase in construction cost was 4.48%, annualized. Construction put in place during April 2019, at a seasonally adjusted annualized rate of $1.299 trillion, was 1.2% below construction put in place in April 2018.
In its just-released second quarter Construction Cost Report for North America, which is based on data from a dozen U.S. markets ansdn two Canadian markets, the construction management consultant Rider Levett Bucknall reiterates the financial and time impacts that the shortage of qualified trade workers is having on the construction industry’s productivity and expansion.
“Even as technology transforms the jobsite, improving both efficiency and worker safety, skilled-labor recruitment and retention are essential to the future of construction,” writes Julian Anderson, FRICS, Rider Levett Bucknall’s President-North America. “As worker shortage makes projects more costly and slower to build, the risk of undermining broader economic growth increases.”
RLB’s National Construction Cost Index stood at 200.55 in the second quarter of 2019, up from 189.8 in the same quarter a year earlier, and 182.16 in Q2 2017. Keep in mind that these increases are occurring at a time when there has been relatively little inflation in the economy.

The construction backlog in North America was more than nine months in the second quarter. Image: Rider Levett Bucknall, from Associated Builders and Contractors estimates.
RLB's estimates are in line Turner Construction's quarterly Building Cost Index (https://bit.ly/2xWrf61), which the GC giant released on July 16. That Index, at 1149, was up 1.23% over the first quarter, and 5.51% over the second quarter of 2018. “Contractors continue to be selective due to the availability of skilled labor,” wrote Attilio Rivetti, Turner's vice president responsible for compiling its cost index.
To further make its case, RLB cites the Associated Builders and Contractors’ Construction Backlog Indicator, which reflects the amount of work that will be performed by commercial and industrial contractors in the months ahead. The backlog for 2018 averaged 9.15 months, slightly below the 2017 average but still up 17% from 2011.
The report breaks down current building costs by market and by seven typologies: offices, retail, hotels, hospitals, warehouses, parking, and residential. For example, Las Vegas, Phoenix, Portland, Seattle, and Denver continue to be relative bargains for office construction, based on their costs per sf. Los Angeles, Washington DC, and New York are the high-priced spreads when building hospitals. As for hotel construction, Honolulu and San Francisco are priciest.
Overall, Chicago experienced the greatest increase in construction bid costs (including materials, labor, and fees), 8.77%, between April 2018 and April 2019, followed San Francisco (7.05%), Portland (6.82%), Seattle (6.68%), Phoenix (6.47%), and Honolulu (5.83%), all above the national average increase.
Los Angeles, while no slouch on the construction front, was the only metro that RLB tracks that experienced a decrease in construction costs in the second quarter, down 1.22%.

Chicago experienced the highest percentage increase in quarterly construction costs. Image: Rider Levett Bucknall
Through the first quarter of 2019, construction unemployment remained steady at 5.2%. The vast majority of construction firms are still having trouble filling open positions. And this situation could worsen, according to the Associated General Contractors of America, as a result of the Trump Administration’s proposal, announced last month, which would exclude the construction sector from the Labor Department’s apprenticeship framework. (Currently, more than three quarters of the federally administered apprenticeships in the U.S. are either in construction or part of military training, notes RLB.)
In a separate report that gauges construction activity by the number of cranes in use in North America, RLB’s July survey marked the fourth consecutive increase. However, only two of 11 U.S. markets tracked—Los Angeles and Denver—saw an increase in cranes. Five other cities were steady.
Cranes for commercial projects were up nationally and accounted for 41% of the cranes in use in New York City. In all markets, mixed-use and multifamily residential construction accounted for 67% of the cranes counted. In Seattle alone, mixed use and residential required 78% of cranes used.
Related Stories
Market Data | Sep 6, 2023
Far slower construction activity forecast in JLL’s Midyear update
The good news is that market data indicate total construction costs are leveling off.

Giants 400 | Sep 5, 2023
Top 80 Construction Management Firms for 2023
Alfa Tech, CBRE Group, Skyline Construction, Hill International, and JLL top the rankings of the nation's largest construction management (as agent) and program/project management firms for nonresidential buildings and multifamily housing work, as reported in Building Design+Construction's 2023 Giants 400 Report.

Giants 400 | Sep 5, 2023
Top 150 Contractors for 2023
Turner Construction, STO Building Group, DPR Construction, Whiting-Turner Contracting Co., and Clark Group head the ranking of the nation's largest general contractors, CM at risk firms, and design-builders for nonresidential buildings and multifamily buildings work, as reported in Building Design+Construction's 2023 Giants 400 Report.

Market Data | Sep 5, 2023
Nonresidential construction spending increased 0.1% in July 2023
National nonresidential construction spending grew 0.1% in July, according to an Associated Builders and Contractors analysis of data published today by the U.S. Census Bureau. On a seasonally adjusted annualized basis, nonresidential spending totaled $1.08 trillion and is up 16.5% year over year.

Giants 400 | Aug 31, 2023
Top 35 Engineering Architecture Firms for 2023
Jacobs, AECOM, Alfa Tech, Burns & McDonnell, and Ramboll top the rankings of the nation's largest engineering architecture (EA) firms for nonresidential buildings and multifamily buildings work, as reported in Building Design+Construction's 2023 Giants 400 Report.

Giants 400 | Aug 22, 2023
Top 115 Architecture Engineering Firms for 2023
Stantec, HDR, Page, HOK, and Arcadis North America top the rankings of the nation's largest architecture engineering (AE) firms for nonresidential building and multifamily housing work, as reported in Building Design+Construction's 2023 Giants 400 Report.

Giants 400 | Aug 22, 2023
2023 Giants 400 Report: Ranking the nation's largest architecture, engineering, and construction firms
A record 552 AEC firms submitted data for BD+C's 2023 Giants 400 Report. The final report includes 137 rankings across 25 building sectors and specialty categories.

Giants 400 | Aug 22, 2023
Top 175 Architecture Firms for 2023
Gensler, HKS, Perkins&Will, Corgan, and Perkins Eastman top the rankings of the nation's largest architecture firms for nonresidential building and multifamily housing work, as reported in Building Design+Construction's 2023 Giants 400 Report.
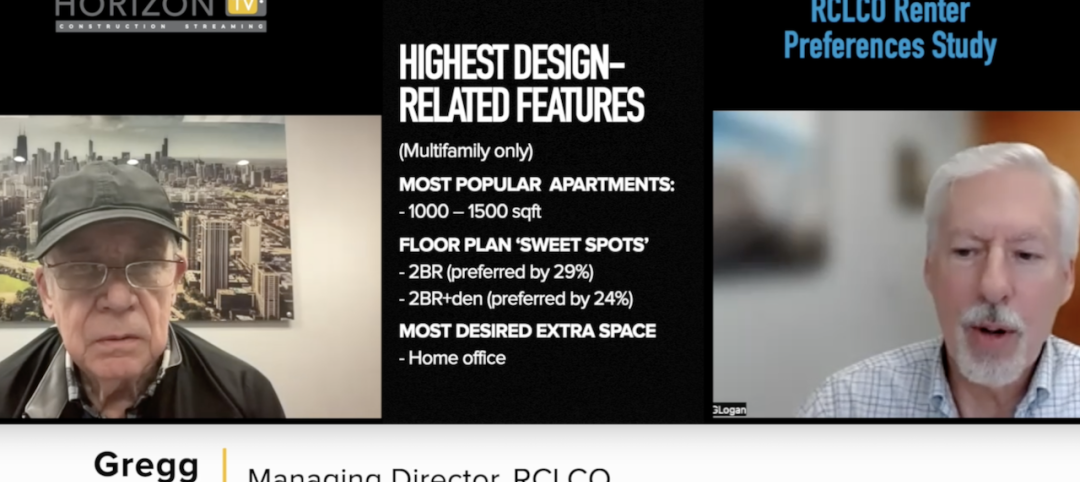
Apartments | Aug 22, 2023
Key takeaways from RCLCO's 2023 apartment renter preferences study
Gregg Logan, Managing Director of real estate consulting firm RCLCO, reveals the highlights of RCLCO's new research study, “2023 Rental Consumer Preferences Report.” Logan speaks with BD+C's Robert Cassidy.
Market Data | Aug 18, 2023
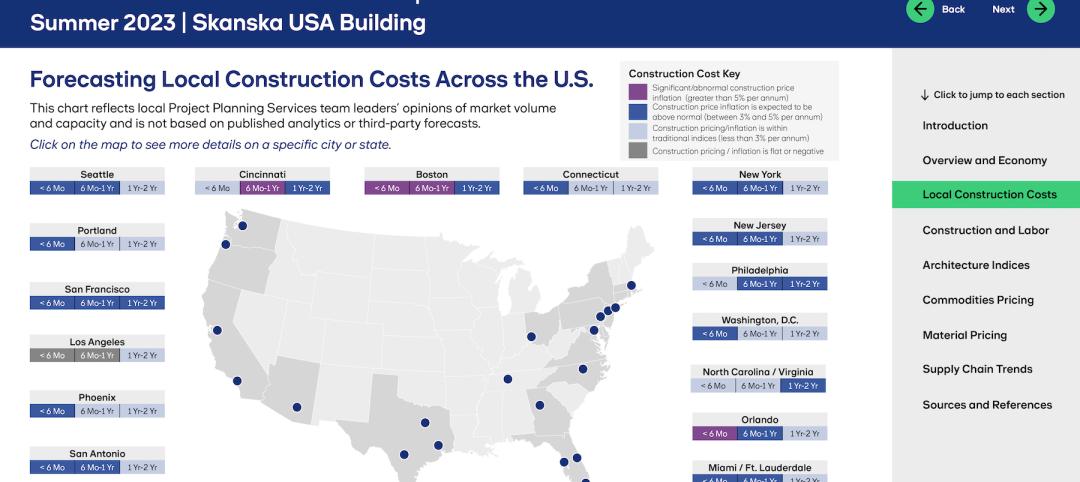
Construction soldiers on, despite rising materials and labor costs
Quarterly analyses from Skanska, Mortenson, and Gordian show nonresidential building still subject to materials and labor volatility, and regional disparities.


