


Through April of this year, the national average increase in construction cost was 4.48%, annualized. Construction put in place during April 2019, at a seasonally adjusted annualized rate of $1.299 trillion, was 1.2% below construction put in place in April 2018.
In its just-released second quarter Construction Cost Report for North America, which is based on data from a dozen U.S. markets ansdn two Canadian markets, the construction management consultant Rider Levett Bucknall reiterates the financial and time impacts that the shortage of qualified trade workers is having on the construction industry’s productivity and expansion.
“Even as technology transforms the jobsite, improving both efficiency and worker safety, skilled-labor recruitment and retention are essential to the future of construction,” writes Julian Anderson, FRICS, Rider Levett Bucknall’s President-North America. “As worker shortage makes projects more costly and slower to build, the risk of undermining broader economic growth increases.”
RLB’s National Construction Cost Index stood at 200.55 in the second quarter of 2019, up from 189.8 in the same quarter a year earlier, and 182.16 in Q2 2017. Keep in mind that these increases are occurring at a time when there has been relatively little inflation in the economy.

The construction backlog in North America was more than nine months in the second quarter. Image: Rider Levett Bucknall, from Associated Builders and Contractors estimates.
RLB's estimates are in line Turner Construction's quarterly Building Cost Index (https://bit.ly/2xWrf61), which the GC giant released on July 16. That Index, at 1149, was up 1.23% over the first quarter, and 5.51% over the second quarter of 2018. “Contractors continue to be selective due to the availability of skilled labor,” wrote Attilio Rivetti, Turner's vice president responsible for compiling its cost index.
To further make its case, RLB cites the Associated Builders and Contractors’ Construction Backlog Indicator, which reflects the amount of work that will be performed by commercial and industrial contractors in the months ahead. The backlog for 2018 averaged 9.15 months, slightly below the 2017 average but still up 17% from 2011.
The report breaks down current building costs by market and by seven typologies: offices, retail, hotels, hospitals, warehouses, parking, and residential. For example, Las Vegas, Phoenix, Portland, Seattle, and Denver continue to be relative bargains for office construction, based on their costs per sf. Los Angeles, Washington DC, and New York are the high-priced spreads when building hospitals. As for hotel construction, Honolulu and San Francisco are priciest.
Overall, Chicago experienced the greatest increase in construction bid costs (including materials, labor, and fees), 8.77%, between April 2018 and April 2019, followed San Francisco (7.05%), Portland (6.82%), Seattle (6.68%), Phoenix (6.47%), and Honolulu (5.83%), all above the national average increase.
Los Angeles, while no slouch on the construction front, was the only metro that RLB tracks that experienced a decrease in construction costs in the second quarter, down 1.22%.

Chicago experienced the highest percentage increase in quarterly construction costs. Image: Rider Levett Bucknall
Through the first quarter of 2019, construction unemployment remained steady at 5.2%. The vast majority of construction firms are still having trouble filling open positions. And this situation could worsen, according to the Associated General Contractors of America, as a result of the Trump Administration’s proposal, announced last month, which would exclude the construction sector from the Labor Department’s apprenticeship framework. (Currently, more than three quarters of the federally administered apprenticeships in the U.S. are either in construction or part of military training, notes RLB.)
In a separate report that gauges construction activity by the number of cranes in use in North America, RLB’s July survey marked the fourth consecutive increase. However, only two of 11 U.S. markets tracked—Los Angeles and Denver—saw an increase in cranes. Five other cities were steady.
Cranes for commercial projects were up nationally and accounted for 41% of the cranes in use in New York City. In all markets, mixed-use and multifamily residential construction accounted for 67% of the cranes counted. In Seattle alone, mixed use and residential required 78% of cranes used.
Related Stories

Market Data | Jul 10, 2020
5 must reads for the AEC industry today: July 10, 2020
The world's tallest hybrid timber tower and the Florida Gators have a new $65 million ballpark.

Market Data | Jul 9, 2020
6 must reads for the AEC industry today: July 9, 2020
The world's most sustainable furniture factory and what will construction look like when COVID-19 ends?
Market Data | Jul 8, 2020
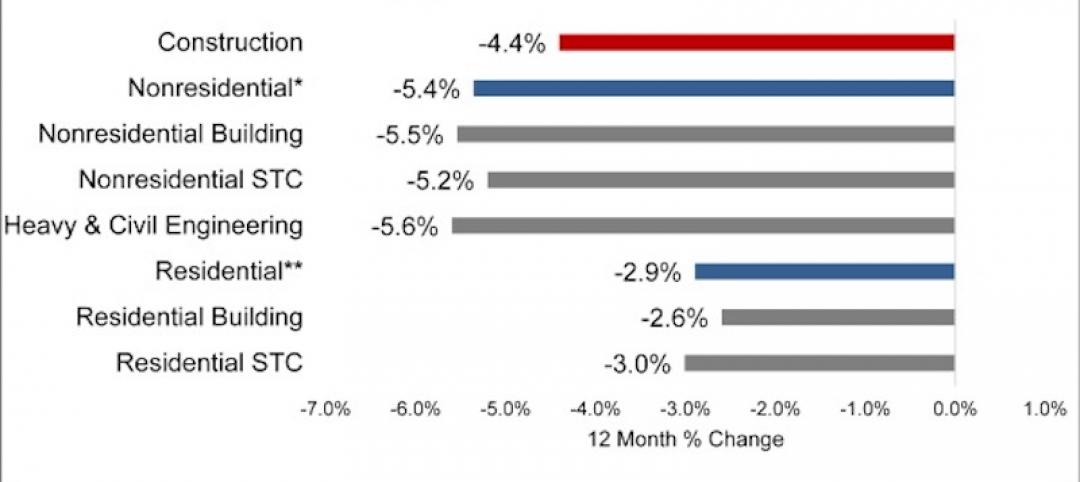
North America’s construction output to fall by 6.5% in 2020, says GlobalData
Even though all construction activities have been allowed to continue in most parts of the US and Canada since the start of the COVID-19 pandemic, many projects in the bidding or final planning stages have been delayed or canceled.
Market Data | Jul 8, 2020
5 must reads for the AEC industry today: July 8, 2020
AEMSEN develops concept for sustainable urban living and nonresidential construction has recovered 56% of jobs lost since March.
Market Data | Jul 7, 2020
Nonresidential construction has recovered 56% of jobs lost since March employment report
Nonresidential construction employment added 74,700 jobs on net in June.

Market Data | Jul 7, 2020
7 must reads for the AEC industry today: July 7, 2020
Construction industry adds 158,000 workers in June and mall owners open micro distribution hubs for e-commerce fulfillment.

Market Data | Jul 6, 2020
Nonresidential construction spending falls modestly in May
Private nonresidential spending declined 2.4% in May and public nonresidential construction spending increased 1.2%.

Market Data | Jul 6, 2020
Construction industry adds 158,000 workers in June but infrastructure jobs decline
Gains in June are concentrated in homebuilding as state and local governments postpone or cancel roads and other projects in face of looming budget deficits.

Market Data | Jul 6, 2020
5 must reads for the AEC industry today: July 6, 2020
Demand growth for mass timber components and office demand has increased as workers return.

Market Data | Jul 2, 2020
Fall in US construction spending in May shows weakness of country’s construction industry, says GlobalData
Dariana Tani, Economist at GlobalData, a leading data and analytics company, offers her view on the situation


