


Providing more evidence of a strengthening economy, Associated Builders and Contractors’ (ABC) Construction Backlog Indicator (CBI) set a record as it expanded to 9.45 months during the third quarter of 2017, up 9.8 percent from the second quarter to the longest backlog reading in the eight-year history of the series. CBI is up by 0.8 months, or 9.2 percent, on a year-over-year basis.
CBI is a leading economic indicator that reflects the amount of construction work under contract, but not yet completed. CBI is measured in months, with a lengthening backlog implying expanding demand for construction services.
“The latest backlog reading strongly suggests the post-2009 economic recovery is picking up steam and that the current construction spending cycle, in place since early 2011 for many contractors, is not on the verge of concluding,” said Basu. “Indeed, if anything, the CBI indicates that nonresidential construction firms are becoming busier due to a confluence of factors, including growing business confidence over the past year and a recent rise in energy prices, which is supporting more investment among energy explorers, producers and distributors.
“With economic growth picking up recently, interest rates staying low, asset prices remaining high and confidence elevated among consumers and businesses alike, the nonresidential construction cycle stands to get even hotter in the near term. That should represent a source of joy to contractors, but undoubtedly many are unnerved by growing pressures to secure suitably trained craftspeople who can support on-time, on-budget project delivery. The upshot is that wage pressures will continue to build in the U.S. construction industry. However, based on the most recent CBI, increasing delivery costs have not yet begun to meaningfully slow the nonresidential construction sector’s ongoing expansion cycle.”

Highlights by Region
⦁ Backlog in the South surged to 11.3 months during the third quarter, the highest reading in the history of the series. Many will conclude that this is at least partially due to the storms that raced across Texas, Florida and other communities during the quarter, but there are other factors at work, including the ongoing boom in commercial construction in the Dallas, Atlanta and Miami metropolitan areas.
⦁ Increased activity in major cities along the Boston-to-Washington corridor continued to drive backlog data higher in the Northeast. At 10.2 months, the Northeast has matched its lengthiest backlog in the history of the series, in the fourth quarter of 2014.
⦁ Backlog in the Middle States, where growth has been softer in places like Illinois and Kansas, shrank by 0.3 months during the third quarter. Still, regional backlog can be characterized as stable.
⦁ Backlog in the West was slightly shorter during the third quarter and stands at roughly the same level as one year ago. Given the elevated levels of construction apparent in markets like Las Vegas, Portland and San Jose, one can only conclude that the region’s lower average backlog level compared to other regions is at least partially attributable to a very competitive environment associated with an entrepreneurial climate that spawns more start-up construction firms than other parts of the country. Wildfires impacting much of California also likely stalled a certain level of construction and contractual activity during the third quarter.

Highlights by Industry
⦁ Backlog in the commercial/institutional segment expanded briskly, increasing by nearly a full month during the third quarter, and now stands at 9.31 months.
⦁ Average backlog in the heavy industrial category fell to 4.46 months during the third quarter, continuing what has been two years of steady shrinkage aligned with observed declines in construction spending related to U.S. manufacturing.
⦁ Backlog in the infrastructure category expanded during the third quarter to 12.53 months, the highest reading on record for the segment and an indication that improving state and local government finances may finally be translating into higher capital spending.
Highlights by Company Size
⦁ Large firms, those with annual revenues in excess of $100 million, experienced a collective average backlog increase to 13.8 months during the third quarter. Despite the sharp quarterly rise, backlog in the category is virtually unchanged from the same time one year ago.
⦁ Backlog among firms with annual revenues between $50 million and $100 million also surged during the third quarter, increasing by more than two months. Backlog in this category stands at levels last observed in 2013 when the construction recovery began to heat up in earnest.
⦁ Backlog among firms with between $30 million and $50 million in annual revenues lengthened modestly to 11.4 months during the third quarter, the third highest reading on record.
⦁ Backlog for firms with annual revenues less than $30 million remain remarkably stable at 7.7 months. For the past eleven quarters, backlog for this group, which is heavily tilted toward subcontractors, has remained between 7.2 and 8.1 months.
Related Stories

Giants 400 | Aug 22, 2023
2023 Giants 400 Report: Ranking the nation's largest architecture, engineering, and construction firms
A record 552 AEC firms submitted data for BD+C's 2023 Giants 400 Report. The final report includes 137 rankings across 25 building sectors and specialty categories.

Giants 400 | Aug 22, 2023
Top 175 Architecture Firms for 2023
Gensler, HKS, Perkins&Will, Corgan, and Perkins Eastman top the rankings of the nation's largest architecture firms for nonresidential building and multifamily housing work, as reported in Building Design+Construction's 2023 Giants 400 Report.
Apartments | Aug 22, 2023
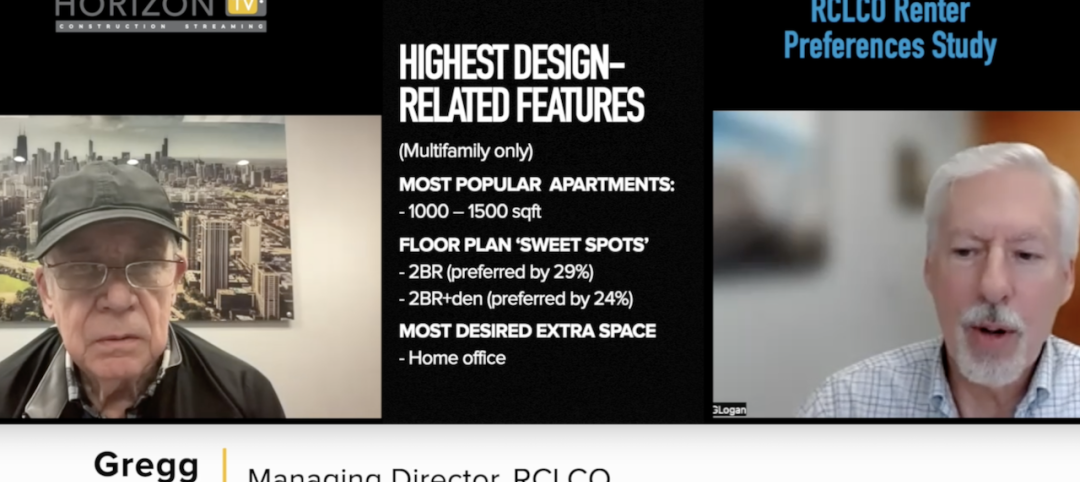
Key takeaways from RCLCO's 2023 apartment renter preferences study
Gregg Logan, Managing Director of real estate consulting firm RCLCO, reveals the highlights of RCLCO's new research study, “2023 Rental Consumer Preferences Report.” Logan speaks with BD+C's Robert Cassidy.
Market Data | Aug 18, 2023
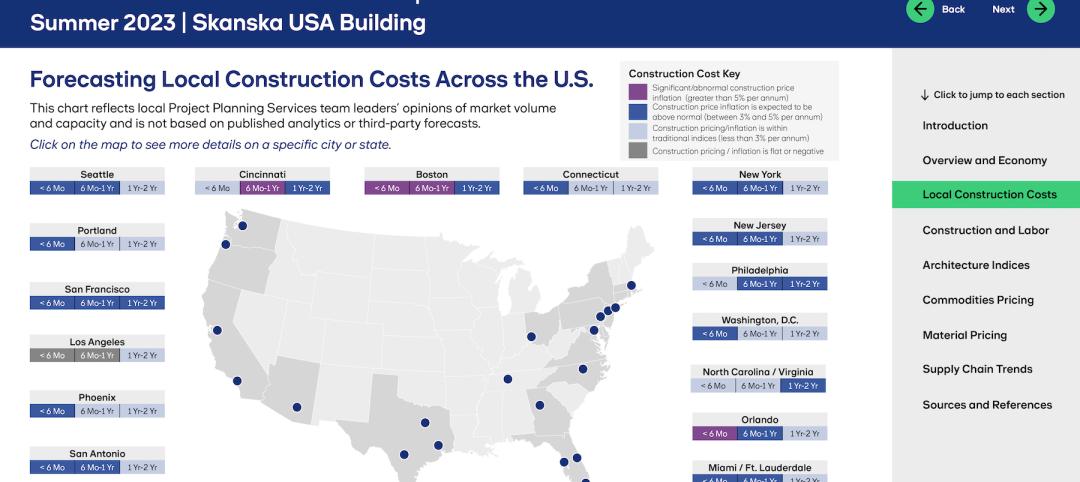
Construction soldiers on, despite rising materials and labor costs
Quarterly analyses from Skanska, Mortenson, and Gordian show nonresidential building still subject to materials and labor volatility, and regional disparities.
Apartments | Aug 14, 2023
Yardi Matrix updates near-term multifamily supply forecast
The multifamily housing supply could increase by up to nearly 7% by the end of 2023, states the latest Multifamily Supply Forecast from Yardi Matrix.

Hotel Facilities | Aug 2, 2023
Top 5 markets for hotel construction
According to the United States Construction Pipeline Trend Report by Lodging Econometrics (LE) for Q2 2023, the five markets with the largest hotel construction pipelines are Dallas with a record-high 184 projects/21,501 rooms, Atlanta with 141 projects/17,993 rooms, Phoenix with 119 projects/16,107 rooms, Nashville with 116 projects/15,346 rooms, and Los Angeles with 112 projects/17,797 rooms.

Market Data | Aug 1, 2023
Nonresidential construction spending increases slightly in June
National nonresidential construction spending increased 0.1% in June, according to an Associated Builders and Contractors analysis of data published today by the U.S. Census Bureau. Spending is up 18% over the past 12 months. On a seasonally adjusted annualized basis, nonresidential spending totaled $1.07 trillion in June.

Hotel Facilities | Jul 27, 2023
U.S. hotel construction pipeline remains steady with 5,572 projects in the works
The hotel construction pipeline grew incrementally in Q2 2023 as developers and franchise companies push through short-term challenges while envisioning long-term prospects, according to Lodging Econometrics.

Hotel Facilities | Jul 26, 2023
Hospitality building construction costs for 2023
Data from Gordian breaks down the average cost per square foot for 15-story hotels, restaurants, fast food restaurants, and movie theaters across 10 U.S. cities: Boston, Chicago, Las Vegas, Los Angeles, Miami, New Orleans, New York, Phoenix, Seattle, and Washington, D.C.

Market Data | Jul 24, 2023
Leading economists call for 2% increase in building construction spending in 2024
Following a 19.7% surge in spending for commercial, institutional, and industrial buildings in 2023, leading construction industry economists expect spending growth to come back to earth in 2024, according to the July 2023 AIA Consensus Construction Forecast Panel.


