


Providing more evidence of a strengthening economy, Associated Builders and Contractors’ (ABC) Construction Backlog Indicator (CBI) set a record as it expanded to 9.45 months during the third quarter of 2017, up 9.8 percent from the second quarter to the longest backlog reading in the eight-year history of the series. CBI is up by 0.8 months, or 9.2 percent, on a year-over-year basis.
CBI is a leading economic indicator that reflects the amount of construction work under contract, but not yet completed. CBI is measured in months, with a lengthening backlog implying expanding demand for construction services.
“The latest backlog reading strongly suggests the post-2009 economic recovery is picking up steam and that the current construction spending cycle, in place since early 2011 for many contractors, is not on the verge of concluding,” said Basu. “Indeed, if anything, the CBI indicates that nonresidential construction firms are becoming busier due to a confluence of factors, including growing business confidence over the past year and a recent rise in energy prices, which is supporting more investment among energy explorers, producers and distributors.
“With economic growth picking up recently, interest rates staying low, asset prices remaining high and confidence elevated among consumers and businesses alike, the nonresidential construction cycle stands to get even hotter in the near term. That should represent a source of joy to contractors, but undoubtedly many are unnerved by growing pressures to secure suitably trained craftspeople who can support on-time, on-budget project delivery. The upshot is that wage pressures will continue to build in the U.S. construction industry. However, based on the most recent CBI, increasing delivery costs have not yet begun to meaningfully slow the nonresidential construction sector’s ongoing expansion cycle.”

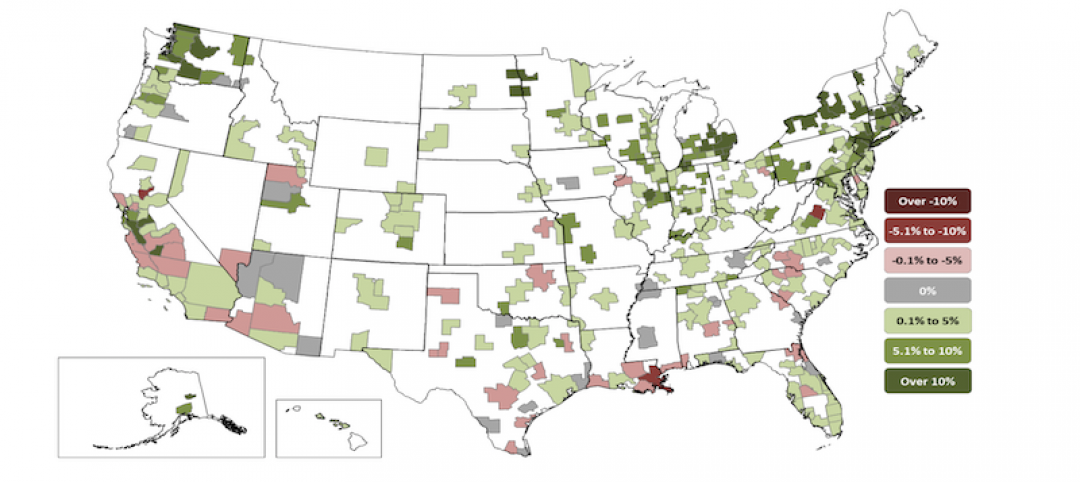
Highlights by Region
⦁ Backlog in the South surged to 11.3 months during the third quarter, the highest reading in the history of the series. Many will conclude that this is at least partially due to the storms that raced across Texas, Florida and other communities during the quarter, but there are other factors at work, including the ongoing boom in commercial construction in the Dallas, Atlanta and Miami metropolitan areas.
⦁ Increased activity in major cities along the Boston-to-Washington corridor continued to drive backlog data higher in the Northeast. At 10.2 months, the Northeast has matched its lengthiest backlog in the history of the series, in the fourth quarter of 2014.
⦁ Backlog in the Middle States, where growth has been softer in places like Illinois and Kansas, shrank by 0.3 months during the third quarter. Still, regional backlog can be characterized as stable.
⦁ Backlog in the West was slightly shorter during the third quarter and stands at roughly the same level as one year ago. Given the elevated levels of construction apparent in markets like Las Vegas, Portland and San Jose, one can only conclude that the region’s lower average backlog level compared to other regions is at least partially attributable to a very competitive environment associated with an entrepreneurial climate that spawns more start-up construction firms than other parts of the country. Wildfires impacting much of California also likely stalled a certain level of construction and contractual activity during the third quarter.

Highlights by Industry
⦁ Backlog in the commercial/institutional segment expanded briskly, increasing by nearly a full month during the third quarter, and now stands at 9.31 months.
⦁ Average backlog in the heavy industrial category fell to 4.46 months during the third quarter, continuing what has been two years of steady shrinkage aligned with observed declines in construction spending related to U.S. manufacturing.
⦁ Backlog in the infrastructure category expanded during the third quarter to 12.53 months, the highest reading on record for the segment and an indication that improving state and local government finances may finally be translating into higher capital spending.
Highlights by Company Size
⦁ Large firms, those with annual revenues in excess of $100 million, experienced a collective average backlog increase to 13.8 months during the third quarter. Despite the sharp quarterly rise, backlog in the category is virtually unchanged from the same time one year ago.
⦁ Backlog among firms with annual revenues between $50 million and $100 million also surged during the third quarter, increasing by more than two months. Backlog in this category stands at levels last observed in 2013 when the construction recovery began to heat up in earnest.
⦁ Backlog among firms with between $30 million and $50 million in annual revenues lengthened modestly to 11.4 months during the third quarter, the third highest reading on record.
⦁ Backlog for firms with annual revenues less than $30 million remain remarkably stable at 7.7 months. For the past eleven quarters, backlog for this group, which is heavily tilted toward subcontractors, has remained between 7.2 and 8.1 months.
Related Stories
Market Data | Jul 29, 2020
62% of metros shed construction jobs from June 2019 to June 2020 as Association calls for new infrastructure funding, other relief steps
New York City and Brockton-Bridgewater-Easton, Mass. have worst 12-month losses, while Austin and Walla Walla, Wash. top job gainers.

Market Data | Jul 29, 2020
6 must reads for the AEC industry today: July 29, 2020
The world's first net-zero airport and California utility adopts climate emergency declaration.

Market Data | Jul 28, 2020
For the fourth consecutive quarter, Los Angeles leads the U.S. hotel construction pipeline at the close of Q2’ 20
New York City continues to have the greatest number of projects under construction, with 106 projects/18,354 rooms.

Market Data | Jul 28, 2020
6 must reads for the AEC industry today: July 28, 2020
St. Petersburg Pier reconstruction completes and post-pandemic workplace design will not be the same for all.

Market Data | Jul 28, 2020
Senate Republicans' coronavirus relief measure includes provisions that will help hard-hit construction firms recover
The HEALS Act includes essential liability, workforce, financial & unemployment reforms, but association will work to get needed infrastructure investments included in final relief measure.

Market Data | Jul 27, 2020
6 must reads for the AEC industry today: July 27, 2020
Customized labs give universities a recruiting edge and the U.S. construction pipeline remains robust through the first half of 2020.

Market Data | Jul 27, 2020
The U.S. construction pipeline remains robust through the first half of 2020, despite pandemic
Projects currently under construction stand at 1,771 projects/235,467 rooms, up 3% and 1% respectively, YOY.
Market Data | Jul 24, 2020
5 must reads for the AEC industry today: July 24, 2020
North Carolina will stop relying on FEMA flood mapping and Cal Poly Pomona's newest project.

Market Data | Jul 23, 2020
New LEED guidance from USGBC helps cities and communities expand resilience efforts in response to the COVID-19 pandemic
Credits integrate public health and social equity with sustainability planning.

Market Data | Jul 23, 2020
6 must reads for the AEC industry today: July 23, 2020
Skanska selects Pickard Chilton to design new ofice tower and days grow long at nursing homes as virus lockdowns drag on.


