


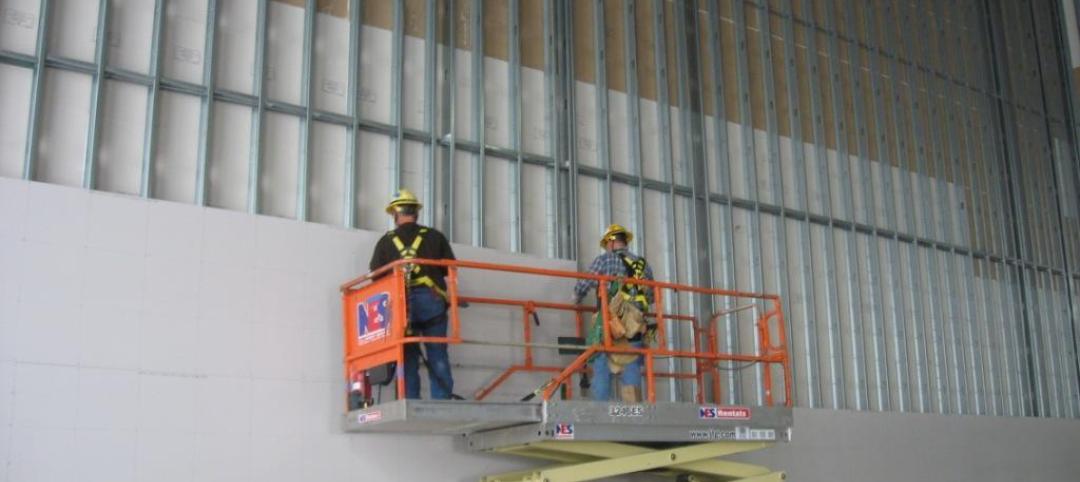
A typical change for construction starts between February and March is around +2.5%. This year, however, dwarfed that, as commercial construction starts climbed 18% from February to March to $28.5 billion, Construction Market Data reports. This is a significant spike even when compared to the typical March to April jump of 12%.
While the number of starts in March 2016 was not much different from March 2015 (+1.6 percent), the number of starts over the first three months of 2016 was 9.8% higher than the first quarter of 2015. The report also notes that February’s starts underwent an upward revision from $19.1 billion to 24.1 billion. The largest adjustments occurred in the structure categories of parking garages, private office buildings, and hospitals/clinics.
The construction sector added 37,000 jobs in March, which is the largest gain so far this year. The first three months of the year have seen an average gain of 25,000 jobs, or an increase of 7.1 percent compared to the 23,000 job-per-month average in Q1 2015. The year-over-year employment in construction for March was 4.7 percent, much faster than the pace for all jobs in the economy. March’s jobless rate for the construction sector was 8.7 percent, not great, but an improvement of March 2015’s 9.5 percent.
Among the types of construction that make up nonresidential building, commercial structures and institutional structures saw the largest change between the first quarter of 2016 and the first quarter of 2015 at +19.9% and +19.5% respectively. Heavy engineering has seen a smaller increase at 5.8%. Meanwhile, industrial construction dropped 59.3%.
Private office buildings accounted for the majority of construction starts in the commercial category with a total of $6.059 billion in the first quarter. Among institutional structures, school and college starts have been responsible for over half of the category’s construction so far with a total of $13.426 billion. Roads and bridges made up over a third of the heavy engineering category with $10.967 billion.
The South and the West saw the largest increases in commercial construction between first quarter 2015 and first quarter 2016 while the Midwest and Northeast saw regressions. The West was up 27.6% from 2015 and the South was up 18%. The Midwest dropped 9.1% and the northeast dropped 6.6%. On the whole, the U.S. has seen a 9.8% increase between 2015 and 2016 so far.
Overall, nonresidential building and engineering/civil work accounts for 62% of total construction in the country with residential activity accounting for 38%.
All of the starts figures found throughout CMD’s report are not seasonally adjusted or altered for inflation. They are expressed in ‘current’ as opposed to ‘constant’ dollars.
To read the report in its entirety and to view accompanying graphs, click here.
Related Stories

Multifamily Housing | Jan 15, 2024
Multifamily rent growth rate unchanged at 0.3%
The National Multifamily Report by Yardi Matrix highlights the highs and lows of the multifamily market in 2023. Despite strong demand, rent growth remained unchanged at 0.3 percent.

Apartments | Jan 9, 2024
Apartment developer survey indicates dramatic decrease in starts this year
Over 56 developers, operators, and investors across the country were surveyed in John Burns Research and Consulting's recently-launched Apartment Developer and Investor Survey.

Self-Storage Facilities | Jan 5, 2024
The state of self-storage in early 2024
As the housing market cools down, storage facilities suffer from lower occupancy and falling rates, according to the December 2023 Yardi Matrix National Self Storage Report.

Urban Planning | Dec 18, 2023
The impacts of affordability, remote work, and personal safety on urban life
Data from Gensler's City Pulse Survey shows that although people are satisfied with their city's experience, it may not be enough.

MFPRO+ News | Dec 11, 2023
U.S. poorly prepared to house growing number of older adults
The U.S. is ill-prepared to provide adequate housing for the growing ranks of older people, according to a report from Harvard University’s Joint Center for Housing Studies. Over the next decade, the U.S. population older than 75 will increase by 45%, growing from 17 million to nearly 25 million, with many expected to struggle financially.
Industry Research | Dec 9, 2023
Two new reports provide guidance for choosing healthier building products
The authors, Perkins&Will and the Healthy Building Network, home in on drywall, flooring, and insulation.The authors, Perkins&Will and the Healthy Building Network, home in on drywall, flooring, and insulation.
Student Housing | Dec 5, 2023
October had fastest start ever for student housing preleasing
The student housing market for the upcoming 2024-2025 leasing season has started sooner and faster than ever.

Industry Research | Nov 28, 2023
Migration trends find top 10 states Americans are moving to
In the StorageCafe analysis of the latest migration trends, each U.S. state was looked at to see the moving patterns of people in the last few years. These are the top 10 states that people are moving to.

Market Data | Nov 27, 2023
Number of employees returning to the office varies significantly by city
While the return-to-the-office trend is felt across the country, the percentage of employees moving back to their offices varies significantly according to geography, according to Eptura’s Q3 Workplace Index.

MFPRO+ News | Nov 21, 2023
Renters value amenities that support a mobile, connected lifestyle
Multifamily renters prioritize features and amenities that reflect a mobile, connected lifestyle, according to the National Multifamily Housing Council (NMHC) and Grace Hill 2024 Renter Preferences Survey.


