An analysis of tidal levels and flood data by the news organization Reuters concludes that flooding has increased along the Eastern Seaboard over the past four decades.
During that period, the number of days a year that tidal waters reached or exceeded National Oceanic and Atmospheric Administration flood thresholds more than tripled in many places. The trend roughly tracks a global rise in sea levels, with an average rise of 8 inches in the past century, according to the 2014 National Climate Assessment.
At flood threshold, water begins pool on streets. If it rises beyond that point, it can close roads, damage property, and overwhelm drainage systems. Since 2001, water has reached flood levels an average of 20 days or more a year in Annapolis, Maryland; Wilmington, North Carolina; Washington, D.C.; Atlantic City, New Jersey; Sandy Hook, New Jersey; and Charleston, South Carolina. Before 1971, none of those locations averaged more than five days a year of flooding.
Reuters’s analysis was based on more than 25 million hourly tide-gauge readings from nearly 70 sites on the Atlantic, Gulf, and Pacific coasts and a comparison of that data to NOAA flood thresholds. Reuters then narrowed the analysis to 25 gauges with data spanning at least 50 years. The organization plans to publish a more in-depth examination of rising sea levels later this year.
(http://www.reuters.com/article/2014/07/10/us-usa-sealevel-flood-idUSKBN0FF20220140710)
Related Stories
Codes and Standards | Sep 10, 2019
Retreat may be the best option for some coastal communities in face of sea level rise
A new study makes the case for relocating in a "strategic, managed" manner.
Codes and Standards | Sep 9, 2019
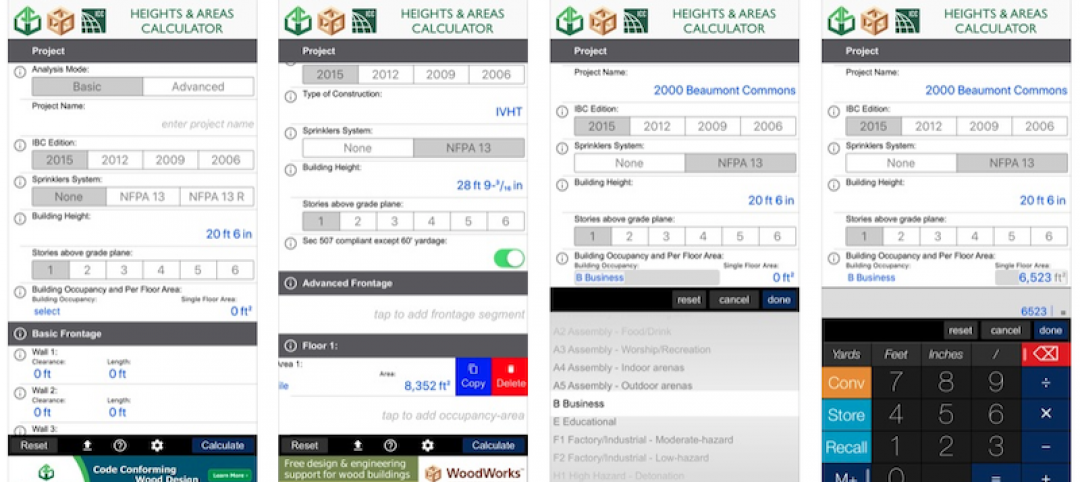
Free app calculates maximum allowable heights and areas for buildings
A free app that calculates the maximum allowable heights and areas for buildings of various occupancy classifications and types of construction has been released.
Codes and Standards | Sep 6, 2019
Standard for assessing frame deflection using one component polyurethane foams updated
The standard offers guidance when installing fenestration products.
Codes and Standards | Aug 29, 2019
The high cost of gridlock: $166 billion per year
Growing economy means more jobs, more cars, more hours stuck in traffic.
Codes and Standards | Aug 29, 2019
Industry leaders ask for government help as trades shortage worsens
AGC asks for more funding for education and increased immigration to fill gaps.
Codes and Standards | Aug 29, 2019
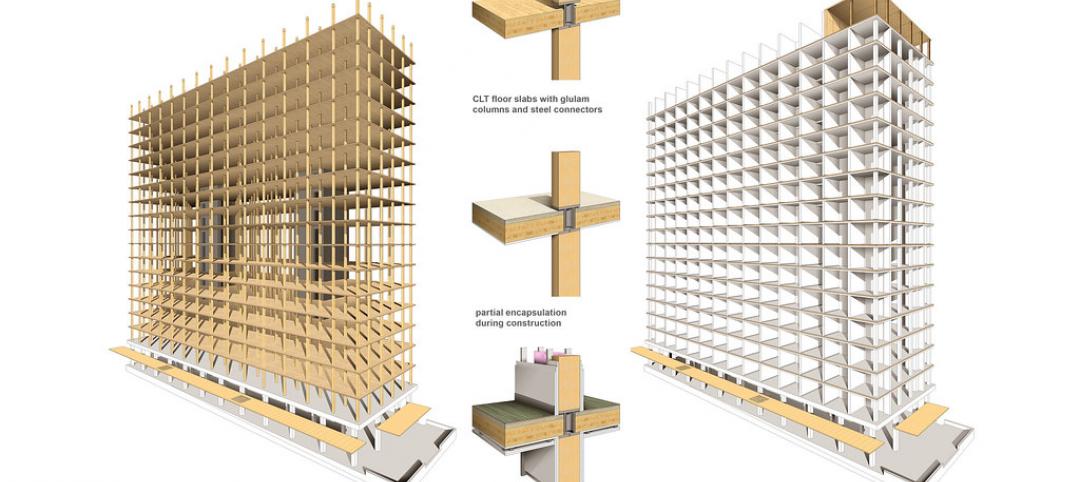
Code-conforming wood design guide available
The guide summarizes provisions for the use of wood and wood products in the 2018 IBC.
Codes and Standards | Aug 29, 2019
LEED residential market up 19% since 2017
The U.S. Green Building Council says that the LEED residential market has grown 19% since 2017. Nearly 500,000 single family, multifamily, and affordable housing units have been certified globally.
Codes and Standards | Aug 27, 2019
Slower speed limits in urban areas offer multiple benefits
Improved safety, better adoption of electric scooters and autonomous vehicles are possible if drivers ease off the accelerator.
Codes and Standards | Aug 27, 2019
Renewables creating significant savings for commercial and public facilities
Payback ranges from five to 15 years.
Codes and Standards | Aug 27, 2019
Oregon rescinds tsunami-zone construction ban
Other states have no ban, but have strengthened building codes for tidal wave resilience.


