


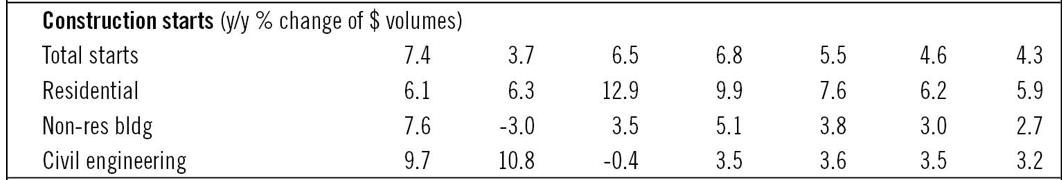
The value of construction starts will increase by 6.5% in 2016 to $562 billion, according to the latest projections from CMD Group and Oxford Economics. And the nonresidential building portion of that total is expected to rebound from its decline in 2015 and show single-digit growth this year.
CMD/Oxford estimates that the dollar volume of nonresidential building (which was off by 3% in 2015) will increase by 3.5% to $193 billion this year. That compares to the 12.9% gain, to $247 billion, that CMD/Oxford anticipates for residential building, and the 0.4% decline, to $122 billion, for engineering/civil construction.
The country’s GDP is expected to inch up by 2.4% this year.
CMD/Oxford expects nonresidential building to rise to by 5.1% to $203 billion in 2017, and to hit $222.7 billion by 2020.
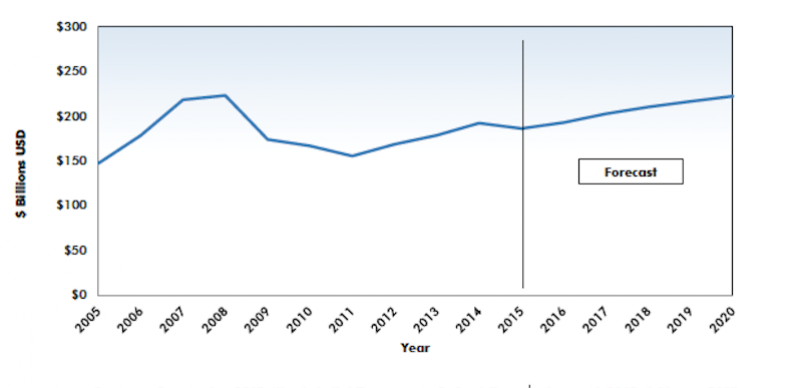 After a down year in 2015, nonresidential building is expected to ease upward this year, driven by low umemployment, borrowing costs, and output trends in relevant sectors. Chart: CMD Group
The short-term drivers of nonresidential building are expected to include the country’s unemployment rate, which CMD/Oxford forecasts will fall to 4.8% this year. Other variables that should contribute to the growth of nonres building are population trends (CMD/Oxford estimates another year of 0.8% growth), improvements in the outputs in certain sectors, and the still-low cost of borrowing money for construciton and investment.
Alex Carrick, CMD’s chief economist, notes that the depreciation of the U.S. dollar is likely to “blunt” industrial starts. On the other hand, increased state and federal spending on infrastructure projects and an improved investment outlook are expected to bolster the values of nonresidential building.
Broken down by sector, CMD/Oxford sees the value of construction for retail and offices easing upward from this year through 2020. Hotel/motel building will be essentially flat. Manufacturing could take a sharp dip this year, and then recover over the proceeding four years. Warehouse construction will be down slightly in 2016, but bounce back in the out years. Medical starts, which are expected to increase by 8.6% in 2016, will then settle around 5% annual growth from 2017 to 2020, as they ride the crest of an aging population.
CMD/Oxford also breaks down nonresidential building by that industry’s four largest states. Texas will be slightly down in 2016 and then flatten with modest increases over the next few years. After a decline in 2015, California’s nonres construction value will move upward, with a particularly strong rise expected for 2020. New York, which was also down in 2015, should see gains, whereas Florida should enjoy about a $1.5 billion jump in values in 2016, and then level off a bit.
Medical building should be one of the bright spots for nonresidential builidng, which is expected to stay positive over the next five years. Chart: CMD Group
Related Stories

Market Data | Mar 24, 2017
These are the most and least innovative states for 2017
Connecticut, Virginia, and Maryland are all in the top 10 most innovative states, but none of them were able to claim the number one spot.

Market Data | Mar 22, 2017
After a strong year, construction industry anxious about Washington’s proposed policy shifts
Impacts on labor and materials costs at issue, according to latest JLL report.

Market Data | Mar 22, 2017
Architecture Billings Index rebounds into positive territory
Business conditions projected to solidify moving into the spring and summer.

Market Data | Mar 15, 2017
ABC's Construction Backlog Indicator fell to end 2016
Contractors in each segment surveyed all saw lower backlog during the fourth quarter, with firms in the heavy industrial segment experiencing the largest drop.

Market Data | Feb 28, 2017
Leopardo’s 2017 Construction Economics Report shows year-over-year construction spending increase of 4.2%
The pace of growth was slower than in 2015, however.

Market Data | Feb 23, 2017
Entering 2017, architecture billings slip modestly
Despite minor slowdown in overall billings, commercial/ industrial and institutional sectors post strongest gains in over 12 months.

Market Data | Feb 16, 2017
How does your hospital stack up? Grumman/Butkus Associates 2016 Hospital Benchmarking Survey
Report examines electricity, fossil fuel, water/sewer, and carbon footprint.

Market Data | Feb 1, 2017
Nonresidential spending falters slightly to end 2016
Nonresidential spending decreased from $713.1 billion in November to $708.2 billion in December.

Market Data | Jan 31, 2017
AIA foresees nonres building spending increasing, but at a slower pace than in 2016
Expects another double-digit growth year for office construction, but a more modest uptick for health-related building.
High-rise Construction | Jan 23, 2017
Growth spurt: A record-breaking 128 buildings of 200 meters or taller were completed in 2016
This marks the third consecutive record-breaking year for building completions over 200 meters.


