


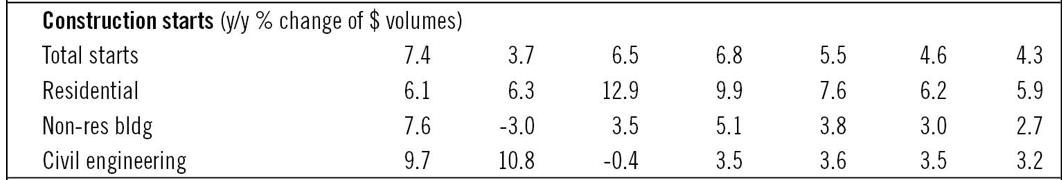
The value of construction starts will increase by 6.5% in 2016 to $562 billion, according to the latest projections from CMD Group and Oxford Economics. And the nonresidential building portion of that total is expected to rebound from its decline in 2015 and show single-digit growth this year.
CMD/Oxford estimates that the dollar volume of nonresidential building (which was off by 3% in 2015) will increase by 3.5% to $193 billion this year. That compares to the 12.9% gain, to $247 billion, that CMD/Oxford anticipates for residential building, and the 0.4% decline, to $122 billion, for engineering/civil construction.
The country’s GDP is expected to inch up by 2.4% this year.
CMD/Oxford expects nonresidential building to rise to by 5.1% to $203 billion in 2017, and to hit $222.7 billion by 2020.
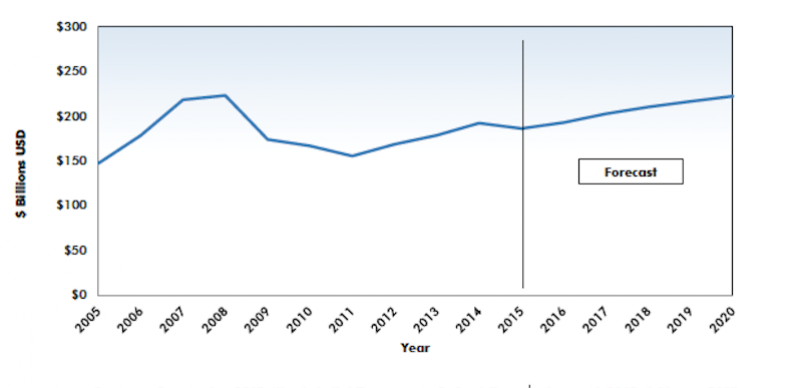 After a down year in 2015, nonresidential building is expected to ease upward this year, driven by low umemployment, borrowing costs, and output trends in relevant sectors. Chart: CMD Group
The short-term drivers of nonresidential building are expected to include the country’s unemployment rate, which CMD/Oxford forecasts will fall to 4.8% this year. Other variables that should contribute to the growth of nonres building are population trends (CMD/Oxford estimates another year of 0.8% growth), improvements in the outputs in certain sectors, and the still-low cost of borrowing money for construciton and investment.
Alex Carrick, CMD’s chief economist, notes that the depreciation of the U.S. dollar is likely to “blunt” industrial starts. On the other hand, increased state and federal spending on infrastructure projects and an improved investment outlook are expected to bolster the values of nonresidential building.
Broken down by sector, CMD/Oxford sees the value of construction for retail and offices easing upward from this year through 2020. Hotel/motel building will be essentially flat. Manufacturing could take a sharp dip this year, and then recover over the proceeding four years. Warehouse construction will be down slightly in 2016, but bounce back in the out years. Medical starts, which are expected to increase by 8.6% in 2016, will then settle around 5% annual growth from 2017 to 2020, as they ride the crest of an aging population.
CMD/Oxford also breaks down nonresidential building by that industry’s four largest states. Texas will be slightly down in 2016 and then flatten with modest increases over the next few years. After a decline in 2015, California’s nonres construction value will move upward, with a particularly strong rise expected for 2020. New York, which was also down in 2015, should see gains, whereas Florida should enjoy about a $1.5 billion jump in values in 2016, and then level off a bit.
Medical building should be one of the bright spots for nonresidential builidng, which is expected to stay positive over the next five years. Chart: CMD Group
Related Stories

Market Data | Mar 2, 2018
Nonresidential construction spending dips slightly in January
Private nonresidential construction fell 1.5% for the month, while public sector nonresidential spending increased 1.9%.

Market Data | Feb 27, 2018
AIA small firm report: Half of employees have ownership stake in their firm
The American Institute of Architects has released its first-ever Small Firm Compensation Report.

Market Data | Feb 21, 2018
Strong start for architecture billings in 2018
The American Institute of Architects reported the January 2018 ABI score was 54.7, up from a score of 52.8 in the previous month.

Multifamily Housing | Feb 15, 2018
United States ranks fourth for renter growth
Renters are on the rise in 21 of the 30 countries examined in RentCafé’s recent study.

Market Data | Feb 1, 2018
Nonresidential construction spending expanded 0.8% in December, brighter days ahead
“The tax cut will further bolster liquidity and confidence, which will ultimately translate into more construction starts and spending,” said ABC Chief Economist Anirban Basu.

Green | Jan 31, 2018
U.S. Green Building Council releases annual top 10 states for LEED green building per capita
Massachusetts tops the list for the second year; New York, Hawaii and Illinois showcase leadership in geographically diverse locations.

Industry Research | Jan 30, 2018
AIA’s Kermit Baker: Five signs of an impending upturn in construction spending
Tax reform implications and rebuilding from natural disasters are among the reasons AIA’s Chief Economist is optimistic for 2018 and 2019.

Market Data | Jan 30, 2018
AIA Consensus Forecast: 4.0% growth for nonresidential construction spending in 2018
The commercial office and retail sectors will lead the way in 2018, with a strong bounce back for education and healthcare.

Market Data | Jan 29, 2018
Year-end data show economy expanded in 2017; Fixed investment surged in fourth quarter
The economy expanded at an annual rate of 2.6% during the fourth quarter of 2017.

Market Data | Jan 25, 2018
Renters are the majority in 42 U.S. cities
Over the past 10 years, the number of renters has increased by 23 million.


