


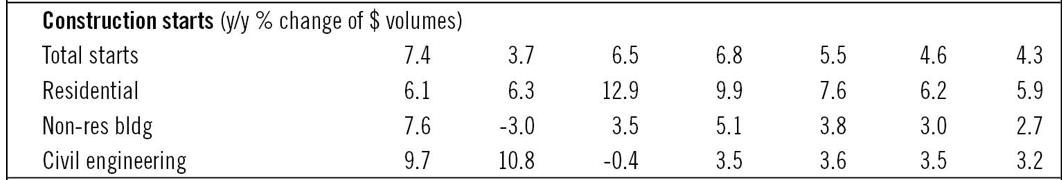
The value of construction starts will increase by 6.5% in 2016 to $562 billion, according to the latest projections from CMD Group and Oxford Economics. And the nonresidential building portion of that total is expected to rebound from its decline in 2015 and show single-digit growth this year.
CMD/Oxford estimates that the dollar volume of nonresidential building (which was off by 3% in 2015) will increase by 3.5% to $193 billion this year. That compares to the 12.9% gain, to $247 billion, that CMD/Oxford anticipates for residential building, and the 0.4% decline, to $122 billion, for engineering/civil construction.
The country’s GDP is expected to inch up by 2.4% this year.
CMD/Oxford expects nonresidential building to rise to by 5.1% to $203 billion in 2017, and to hit $222.7 billion by 2020.
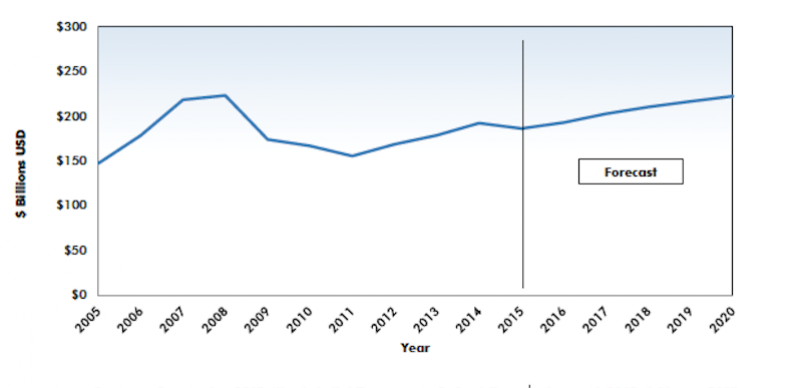 After a down year in 2015, nonresidential building is expected to ease upward this year, driven by low umemployment, borrowing costs, and output trends in relevant sectors. Chart: CMD Group
The short-term drivers of nonresidential building are expected to include the country’s unemployment rate, which CMD/Oxford forecasts will fall to 4.8% this year. Other variables that should contribute to the growth of nonres building are population trends (CMD/Oxford estimates another year of 0.8% growth), improvements in the outputs in certain sectors, and the still-low cost of borrowing money for construciton and investment.
Alex Carrick, CMD’s chief economist, notes that the depreciation of the U.S. dollar is likely to “blunt” industrial starts. On the other hand, increased state and federal spending on infrastructure projects and an improved investment outlook are expected to bolster the values of nonresidential building.
Broken down by sector, CMD/Oxford sees the value of construction for retail and offices easing upward from this year through 2020. Hotel/motel building will be essentially flat. Manufacturing could take a sharp dip this year, and then recover over the proceeding four years. Warehouse construction will be down slightly in 2016, but bounce back in the out years. Medical starts, which are expected to increase by 8.6% in 2016, will then settle around 5% annual growth from 2017 to 2020, as they ride the crest of an aging population.
CMD/Oxford also breaks down nonresidential building by that industry’s four largest states. Texas will be slightly down in 2016 and then flatten with modest increases over the next few years. After a decline in 2015, California’s nonres construction value will move upward, with a particularly strong rise expected for 2020. New York, which was also down in 2015, should see gains, whereas Florida should enjoy about a $1.5 billion jump in values in 2016, and then level off a bit.
Medical building should be one of the bright spots for nonresidential builidng, which is expected to stay positive over the next five years. Chart: CMD Group
Related Stories

Multifamily Housing | Oct 16, 2019
A new study wonders how many retiring adults will be able to afford housing
Harvard’s Joint Center for Housing Studies focuses on growing income disparities among people 50 or older.

Market Data | Oct 9, 2019
Two ULI reports foresee a solid real estate market through 2021
Market watchers, though, caution about a “surfeit” of investment creating a bubble.

Market Data | Oct 4, 2019
Global construction output growth will decline to 2.7% in 2019
It will be the slowest pace of growth in a decade, according to GlobalData.

Market Data | Oct 2, 2019
Spending on nonresidential construction takes a step back in August
Office, healthcare, and public safety are among the fastest-growing sectors, according to the U.S. Census Bureau's latest report.

Market Data | Sep 27, 2019
The global hotel construction pipeline ascends to new record highs
With the exception of Latin America, all regions of the globe either continued to set record high pipeline counts or have already settled into topping-out formations amidst concerns of a worldwide economic slowdown.
Market Data | Sep 25, 2019
Senate introduces The School Safety Clearinghouse Act
Legislation would create a federally funded and housed informational resource on safer school designs.

Market Data | Sep 18, 2019
Substantial decline in Architecture Billings
August report suggests greatest weakness in design activity in several years.

Market Data | Sep 17, 2019
ABC’s Construction Backlog Indicator inches lower in July
Backlog in the heavy industrial category increased by 2.3 months and now stands at its highest level in the history of the CBI series.

Market Data | Sep 13, 2019
Spending on megaprojects, already on the rise, could spike hard in the coming years
A new FMI report anticipates that megaprojects will account for one-fifth of annual construction spending within the next decade.

Architects | Sep 11, 2019
Buoyed by construction activity, architect compensation continues to see healthy gains
The latest AIA report breaks down its survey data by 44 positions and 28 metros.


