


Many U.S. cities are seeing an increase in bicycle commuters, according to new a U.S. Census Bureau report.
Nationwide, the number of people who traveled to work by bike increased roughly 60% during the last decade, from 488,000 in 2000 to 786,000 annually during the 2008-2012 period. This is the largest percentage increase of all commuting modes tracked by the 2000 Census and the 2008-2012 American Community Survey.
"In recent years, many communities have taken steps to support more transportation options, such as bicycling and walking," said Brian McKenzie, a Census Bureau sociologist and the report's author. "For example, many cities have invested in bike share programs, bike lanes and more pedestrian-friendly streets."
While bicyclists account for just 0.6 percent of all commuters, some of the nation's largest cities have more than doubled their rates since 2000. Portland, Ore., had the highest bicycle commuting rate, at 6.1%, up from 1.8% in 2000. In Minneapolis, the rate increased from 1.9% to 4.1%.
The report also looks at the number of people who walk to work. After steadily decreasing since 1980, the percent of people who walk to work has stabilized since 2000. In 1980, 5.6% of workers walked to work, and that rate declined to 2.9% by 2000. However, in the 2008-2012 period, the rate of walkers remained statistically unchanged from 2000. Among larger cities, Boston had the highest rate of walking to work at 15.1%.
The report, "Modes Less Traveled — Bicycling and Walking to Work in the United States: 2008-2012," highlights the trends and socio-economic and geographic differences between motorized and nonmotorized commutes.
Biking to Work Highlights:
- The West had the highest rate of biking to work at 1.1%, and the South had the lowest rate at 0.3%.
- Among large cities, Portland, Ore., had the highest bicycle-commuting rate at 6.1%.
- The median commute time for those who bike to work was about 19.3 minutes.
- Men were more likely to bike to work than women were. The rate of bicycle commuting for men was more than double that of women, 0.8% compared with 0.3%.
- Those with a graduate or professional degree or higher and those with less than a high school degree had the highest rates of biking to work, at 0.9% and 0.7%, respectively.
- 1.5% of those with an income of $10,000 or less commuted to work by bicycle, the highest rate of bicycle commuting by any income category.
- African-Americans had the lowest rate of biking to work at 0.3%, compared with some other race or two or more races who had the highest rate at 0.8%.
Walking to Work Highlights:
- The Northeast showed the highest rate of walking to work at 4.7% of workers. Several of the places with high rates were "college towns," including Ithaca, N.Y., where about 42.4% walked to work. The South had the lowest rate at 1.8%. Among large cities, Boston was one of the highest walking-to-work cities at 15.1%.
- Workers living in core cities walked to work at a rate of 4.3%, compared with 2.4% for workers in suburbs.
- The median commute time for those who walk to work was 11.5 minutes, and they left their home at later hours than other modes.
- Men walked to work at a rate of 2.9% compared with 2.8% for women.
- Those with less than a high school degree had the highest rate of walking to work at 3.7%, followed by those with graduate or professional degrees at 2.7%.
- 8.2% of those with an income of $10,000 or less walked to work, the highest rate of walking to work by any income category.
- Asians and workers of some other race or two or more races had the highest rate of walking to work at 4.0% and 4.2%, respectively.
Related Stories
| Nov 3, 2010
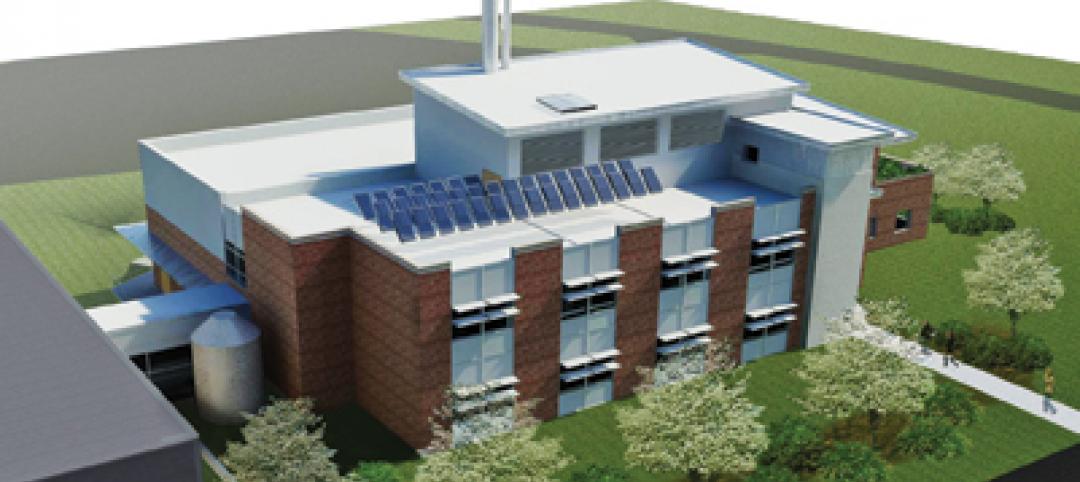
Virginia biofuel research center moving along
The Sustainable Energy Technology Center has broken ground in October on the Danville, Va., campus of the Institute for Advanced Learning and Research. The 25,000-sf facility will be used to develop enhanced bio-based fuels, and will house research laboratories, support labs, graduate student research space, and faculty offices. Rainwater harvesting, a vegetated roof, low-VOC and recycled materials, photovoltaic panels, high-efficiency plumbing fixtures and water-saving systems, and LED light fixtures will be deployed. Dewberry served as lead architect, with Lord Aeck & Sargent serving as laboratory designer and sustainability consultant. Perigon Engineering consulted on high-bay process labs. New Atlantic Contracting is building the facility.
| Nov 3, 2010
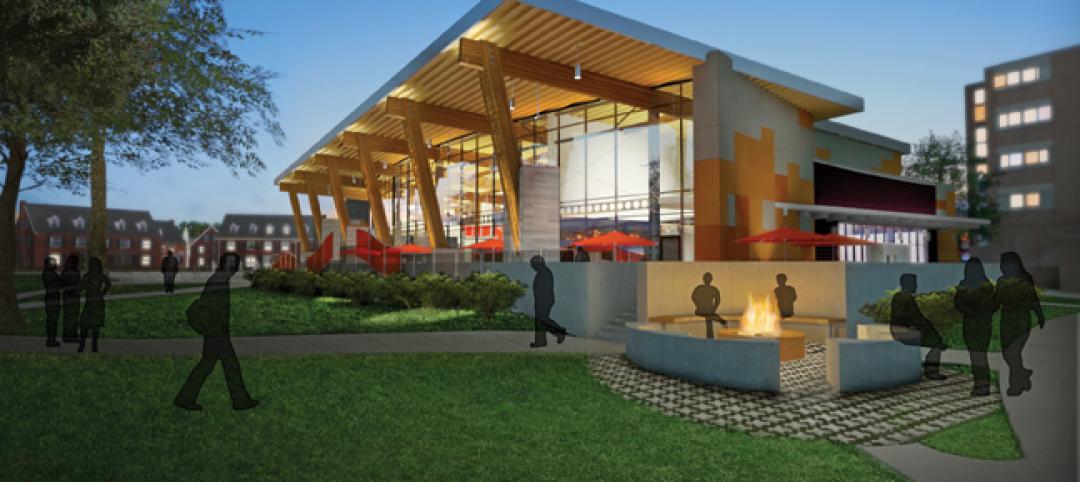
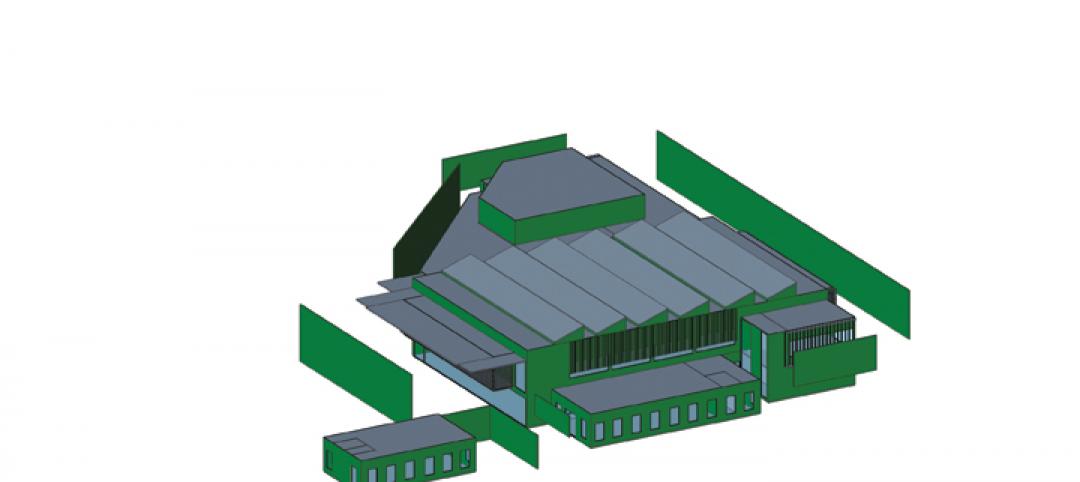
Dining center cooks up LEED Platinum rating
Students at Bowling Green State University in Ohio will be eating in a new LEED Platinum multiuse dining center next fall. The 30,000-sf McDonald Dining Center will have a 700-seat main dining room, a quick-service restaurant, retail space, and multiple areas for students to gather inside and out, including a fire pit and several patios—one of them on the rooftop.
| Nov 2, 2010
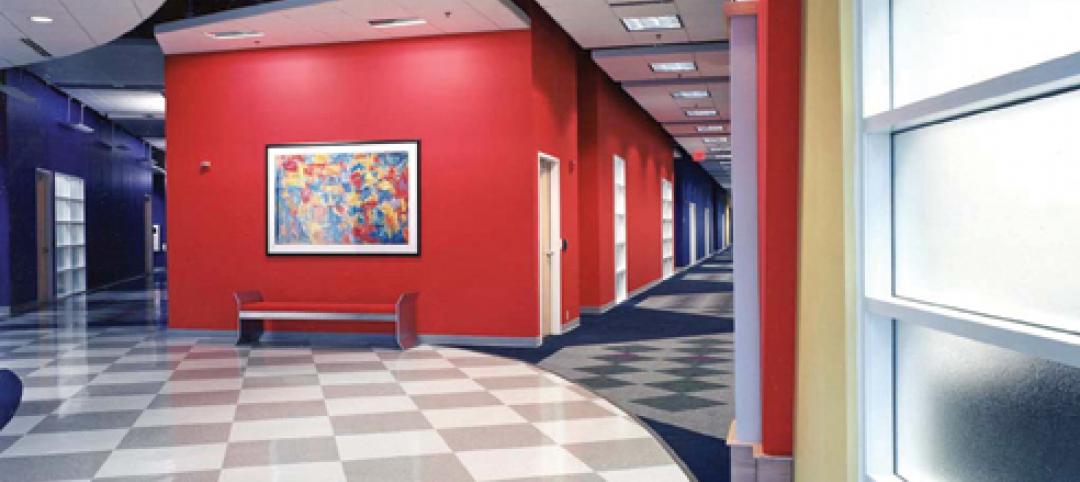
11 Tips for Breathing New Life into Old Office Spaces
A slowdown in new construction has firms focusing on office reconstruction and interior renovations. Three experts from Hixson Architecture Engineering Interiors offer 11 tips for office renovation success. Tip #1: Check the landscaping.
| Nov 2, 2010
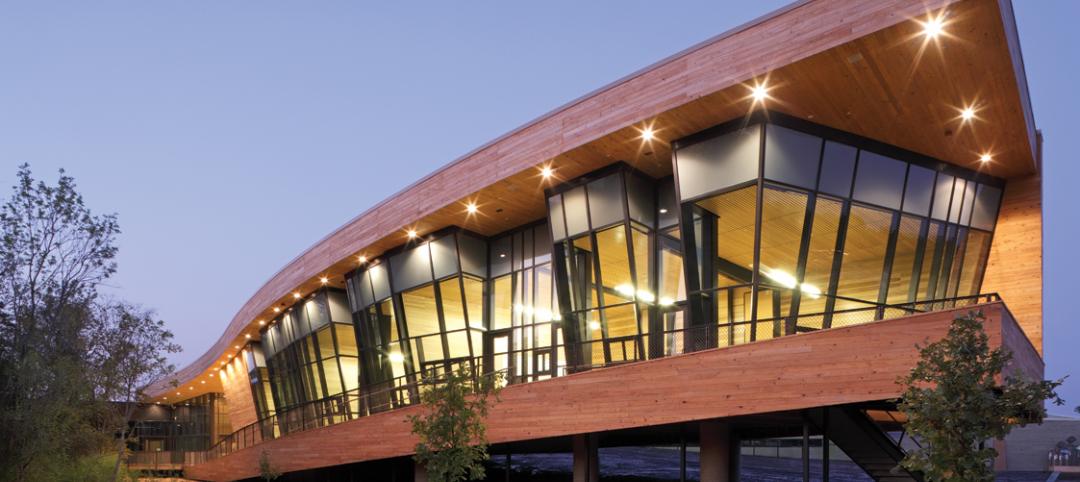
Cypress Siding Helps Nature Center Look its Part
The Trinity River Audubon Center, which sits within a 6,000-acre forest just outside Dallas, utilizes sustainable materials that help the $12.5 million nature center fit its wooded setting and put it on a path to earning LEED Gold.
| Nov 2, 2010
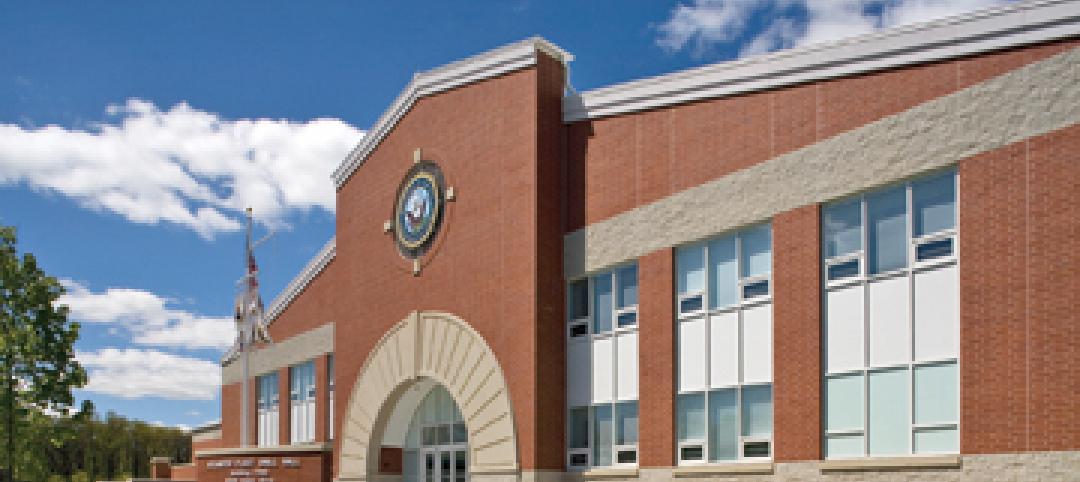
A Look Back at the Navy’s First LEED Gold
Building Design+Construction takes a retrospective tour of a pace-setting LEED project.
| Nov 2, 2010
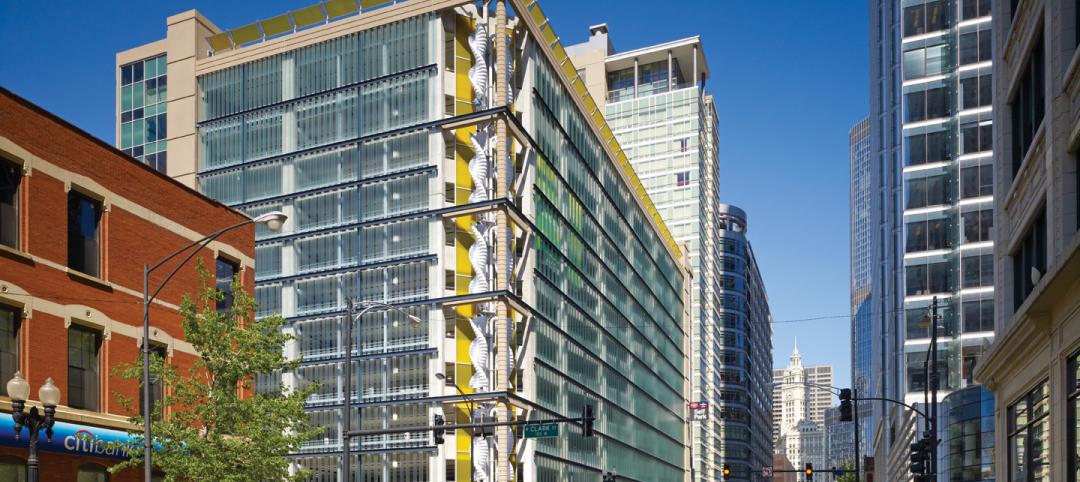
Wind Power, Windy City-style
Building-integrated wind turbines lend a futuristic look to a parking structure in Chicago’s trendy River North neighborhood. Only time will tell how much power the wind devices will generate.
| Nov 2, 2010
Energy Analysis No Longer a Luxury
Back in the halcyon days of 2006, energy analysis of building design and performance was a luxury. Sure, many forward-thinking AEC firms ran their designs through services such as Autodesk’s Green Building Studio and IES’s Virtual Environment, and some facility managers used Honeywell’s Energy Manager and other monitoring software. Today, however, knowing exactly how much energy your building will produce and use is survival of the fittest as energy costs and green design requirements demand precision.

| Nov 2, 2010
Yudelson: ‘If It Doesn’t Perform, It Can’t Be Green’
Jerry Yudelson, prolific author and veteran green building expert, challenges Building Teams to think big when it comes to controlling energy use and reducing carbon emissions in buildings.
| Nov 2, 2010
Historic changes to commercial building energy codes drive energy efficiency, emissions reductions
Revisions to the commercial section of the 2012 International Energy Conservation Code (IECC) represent the largest single-step efficiency increase in the history of the national, model energy. The changes mean that new and renovated buildings constructed in jurisdictions that follow the 2012 IECC will use 30% less energy than those built to current standards.
| Nov 1, 2010
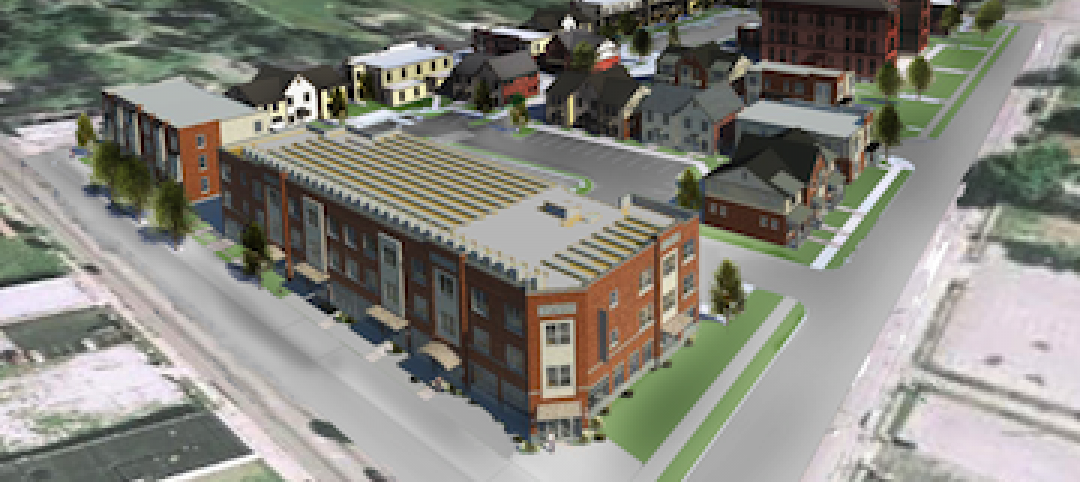
Sustainable, mixed-income housing to revitalize community
The $41 million Arlington Grove mixed-use development in St. Louis is viewed as a major step in revitalizing the community. Developed by McCormack Baron Salazar with KAI Design & Build (architect, MEP, GC), the project will add 112 new and renovated mixed-income rental units (market rate, low-income, and public housing) totaling 162,000 sf, plus 5,000 sf of commercial/retail space.


