


Many U.S. cities are seeing an increase in bicycle commuters, according to new a U.S. Census Bureau report.
Nationwide, the number of people who traveled to work by bike increased roughly 60% during the last decade, from 488,000 in 2000 to 786,000 annually during the 2008-2012 period. This is the largest percentage increase of all commuting modes tracked by the 2000 Census and the 2008-2012 American Community Survey.
"In recent years, many communities have taken steps to support more transportation options, such as bicycling and walking," said Brian McKenzie, a Census Bureau sociologist and the report's author. "For example, many cities have invested in bike share programs, bike lanes and more pedestrian-friendly streets."
While bicyclists account for just 0.6 percent of all commuters, some of the nation's largest cities have more than doubled their rates since 2000. Portland, Ore., had the highest bicycle commuting rate, at 6.1%, up from 1.8% in 2000. In Minneapolis, the rate increased from 1.9% to 4.1%.
The report also looks at the number of people who walk to work. After steadily decreasing since 1980, the percent of people who walk to work has stabilized since 2000. In 1980, 5.6% of workers walked to work, and that rate declined to 2.9% by 2000. However, in the 2008-2012 period, the rate of walkers remained statistically unchanged from 2000. Among larger cities, Boston had the highest rate of walking to work at 15.1%.
The report, "Modes Less Traveled — Bicycling and Walking to Work in the United States: 2008-2012," highlights the trends and socio-economic and geographic differences between motorized and nonmotorized commutes.
Biking to Work Highlights:
- The West had the highest rate of biking to work at 1.1%, and the South had the lowest rate at 0.3%.
- Among large cities, Portland, Ore., had the highest bicycle-commuting rate at 6.1%.
- The median commute time for those who bike to work was about 19.3 minutes.
- Men were more likely to bike to work than women were. The rate of bicycle commuting for men was more than double that of women, 0.8% compared with 0.3%.
- Those with a graduate or professional degree or higher and those with less than a high school degree had the highest rates of biking to work, at 0.9% and 0.7%, respectively.
- 1.5% of those with an income of $10,000 or less commuted to work by bicycle, the highest rate of bicycle commuting by any income category.
- African-Americans had the lowest rate of biking to work at 0.3%, compared with some other race or two or more races who had the highest rate at 0.8%.
Walking to Work Highlights:
- The Northeast showed the highest rate of walking to work at 4.7% of workers. Several of the places with high rates were "college towns," including Ithaca, N.Y., where about 42.4% walked to work. The South had the lowest rate at 1.8%. Among large cities, Boston was one of the highest walking-to-work cities at 15.1%.
- Workers living in core cities walked to work at a rate of 4.3%, compared with 2.4% for workers in suburbs.
- The median commute time for those who walk to work was 11.5 minutes, and they left their home at later hours than other modes.
- Men walked to work at a rate of 2.9% compared with 2.8% for women.
- Those with less than a high school degree had the highest rate of walking to work at 3.7%, followed by those with graduate or professional degrees at 2.7%.
- 8.2% of those with an income of $10,000 or less walked to work, the highest rate of walking to work by any income category.
- Asians and workers of some other race or two or more races had the highest rate of walking to work at 4.0% and 4.2%, respectively.
Related Stories

| Feb 15, 2011
LAUSD commissions innovative prefab prototypes for future building
The LA Unified School District, under the leadership of a new facilities director, reversed course regarding prototypes for its new schools and engaged architects to create compelling kit-of-parts schemes that are largely prefabricated.
| Feb 15, 2011
New 2030 Challenge to include carbon footprint of building materials and products
Architecture 2030 has just broadened the scope of its 2030 Challenge, issuing an additional challenge regarding the climate impact of building products. The 2030 Challenge for Products aims to reduce the embodied carbon (meaning the carbon emissions equivalent) of building products 50% by 2030.
| Feb 15, 2011
New Urbanist Andrés Duany: We need a LEED Brown rating
Andrés Duany advocates a "LEED Brown" rating that would give contractors credit for using traditional but low cost measures that are not easy to quantify or certify. He described these steps as "the original green," and "what we did when we didn't have money." Ostensibly, LEED Brown would be in addition to the current Silver, Gold and Platinum ratings.
| Feb 15, 2011
AIA on President Obama's proposed $1 billion investment in energy conservation
The President’s budget increases the value of investment in energy conservation in commercial buildings by roughly $1 billion, reports AIA 2011 President Clark Manus, FAIA. The significant increase from the current tax deduction of $1.80 per sq. ft. now on the books is an increase for which the AIA has been advocating in order to encourage energy conservation.

| Feb 14, 2011
Sustainable Roofing: A Whole-Building Approach
According to sustainability experts, the first step toward designing an energy-efficient roofing system is to see roof materials and systems as an integral component of the enclosure and the building as a whole. Earn 1.0 AIA/CES learning units by studying this article and successfully completing the online exam.


| Feb 11, 2011
Four Products That Stand Up to Hurricanes
What do a panelized wall system, a newly developed roof hatch, spray polyurethane foam, and a custom-made curtain wall have in common? They’ve been extensively researched and tested for their ability to take abuse from the likes of Hurricane Katrina.
| Feb 11, 2011
RS Means Cost Comparison Chart: Office Buildings
This month's RS Means Cost Comparison Chart focuses on office building construction.
| Feb 11, 2011
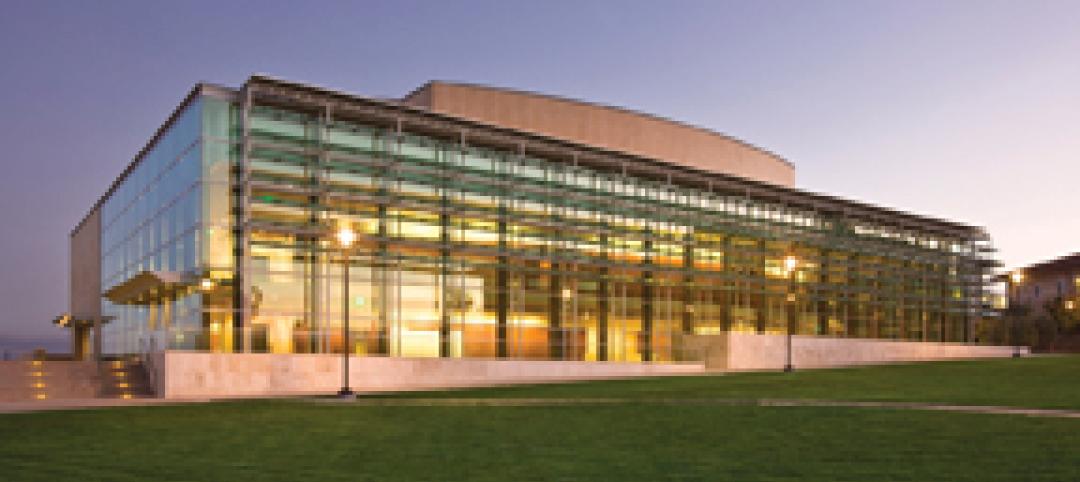
Sustainable features on the bill for dual-building performing arts center at Soka University of America
The $73 million Soka University of America’s new performing arts center and academic complex recently opened on the school’s Aliso Viejo, Calif., campus. McCarthy Building Companies and Zimmer Gunsul Frasca Architects collaborated on the two-building project. One is a three-story, 47,836-sf facility with a grand reception lobby, a 1,200-seat auditorium, and supports spaces. The other is a four-story, 48,974-sf facility with 11 classrooms, 29 faculty offices, a 150-seat black box theater, rehearsal/dance studio, and support spaces. The project, which has a green roof, solar panels, operable windows, and sun-shading devices, is going for LEED Silver.


