


Many U.S. cities are seeing an increase in bicycle commuters, according to new a U.S. Census Bureau report.
Nationwide, the number of people who traveled to work by bike increased roughly 60% during the last decade, from 488,000 in 2000 to 786,000 annually during the 2008-2012 period. This is the largest percentage increase of all commuting modes tracked by the 2000 Census and the 2008-2012 American Community Survey.
"In recent years, many communities have taken steps to support more transportation options, such as bicycling and walking," said Brian McKenzie, a Census Bureau sociologist and the report's author. "For example, many cities have invested in bike share programs, bike lanes and more pedestrian-friendly streets."
While bicyclists account for just 0.6 percent of all commuters, some of the nation's largest cities have more than doubled their rates since 2000. Portland, Ore., had the highest bicycle commuting rate, at 6.1%, up from 1.8% in 2000. In Minneapolis, the rate increased from 1.9% to 4.1%.
The report also looks at the number of people who walk to work. After steadily decreasing since 1980, the percent of people who walk to work has stabilized since 2000. In 1980, 5.6% of workers walked to work, and that rate declined to 2.9% by 2000. However, in the 2008-2012 period, the rate of walkers remained statistically unchanged from 2000. Among larger cities, Boston had the highest rate of walking to work at 15.1%.
The report, "Modes Less Traveled — Bicycling and Walking to Work in the United States: 2008-2012," highlights the trends and socio-economic and geographic differences between motorized and nonmotorized commutes.
Biking to Work Highlights:
- The West had the highest rate of biking to work at 1.1%, and the South had the lowest rate at 0.3%.
- Among large cities, Portland, Ore., had the highest bicycle-commuting rate at 6.1%.
- The median commute time for those who bike to work was about 19.3 minutes.
- Men were more likely to bike to work than women were. The rate of bicycle commuting for men was more than double that of women, 0.8% compared with 0.3%.
- Those with a graduate or professional degree or higher and those with less than a high school degree had the highest rates of biking to work, at 0.9% and 0.7%, respectively.
- 1.5% of those with an income of $10,000 or less commuted to work by bicycle, the highest rate of bicycle commuting by any income category.
- African-Americans had the lowest rate of biking to work at 0.3%, compared with some other race or two or more races who had the highest rate at 0.8%.
Walking to Work Highlights:
- The Northeast showed the highest rate of walking to work at 4.7% of workers. Several of the places with high rates were "college towns," including Ithaca, N.Y., where about 42.4% walked to work. The South had the lowest rate at 1.8%. Among large cities, Boston was one of the highest walking-to-work cities at 15.1%.
- Workers living in core cities walked to work at a rate of 4.3%, compared with 2.4% for workers in suburbs.
- The median commute time for those who walk to work was 11.5 minutes, and they left their home at later hours than other modes.
- Men walked to work at a rate of 2.9% compared with 2.8% for women.
- Those with less than a high school degree had the highest rate of walking to work at 3.7%, followed by those with graduate or professional degrees at 2.7%.
- 8.2% of those with an income of $10,000 or less walked to work, the highest rate of walking to work by any income category.
- Asians and workers of some other race or two or more races had the highest rate of walking to work at 4.0% and 4.2%, respectively.
Related Stories

Mixed-Use | Aug 30, 2017
A 50-acre waterfront redevelopment gets under way in Tampa
Nine architects, three interior designers, and nine contractors are involved in this $3 billion project.

AEC Tech | Aug 25, 2017
Software cornucopia: Jacksonville Jaguars’ new practice facility showcases the power of computational design
The project team employed Revit, Rhino, Grasshopper, Kangaroo, and a host of other software applications to design and build this uber-complex sports and entertainment facility.

Multifamily Housing | Aug 24, 2017
Storage units, lounges most popular indoor and outdoor amenities in multifamily developments
Tenants and condo owners crave extra space for their stuff. Most developers are happy to oblige.
Green | Aug 24, 2017
Business case for WELL still developing after first generation office fitouts completed
The costs ranged from 50 cents to $4 per sf, according to a ULI report.
Healthcare Facilities | Aug 24, 2017
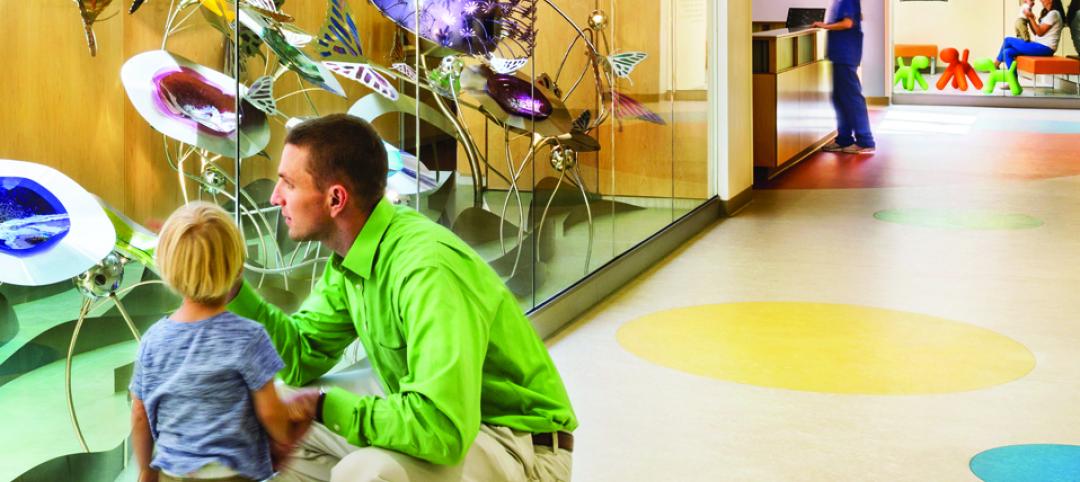
7 design elements for creating timeless pediatric health environments
A recently published report by Shepley Bulfinch presents pediatric healthcare environments as “incubators for hospital design innovation.”
BD+C University Course | Aug 23, 2017
AIA course: New steel systems add strength and beauty
Advances in R&D are fostering new forms of structural and aesthetic steel.

Market Data | Aug 23, 2017
Architecture Billings Index growth moderates
“The July figures show the continuation of healthy trends in the construction sector of our economy,” said AIA Chief Economist, Kermit Baker.

Architects | Aug 21, 2017
AIA: Architectural salaries exceed gains in the broader economy
AIA’s latest compensation report finds average compensation for staff positions up 2.8% from early 2015.

Sports and Recreational Facilities | Aug 18, 2017
Video: Designing the ideal rugby stadium
HOK invited four world-class rugby players into its London studio to discuss what they would like to see in the rugby stadiums of the future.

Architects | Aug 16, 2017
Staffelbach joins DLR Group
The firm will be merging operations immediately with full integration and the name change to DLR Group| Staffelbach effective October 2.


