


Many U.S. cities are seeing an increase in bicycle commuters, according to new a U.S. Census Bureau report.
Nationwide, the number of people who traveled to work by bike increased roughly 60% during the last decade, from 488,000 in 2000 to 786,000 annually during the 2008-2012 period. This is the largest percentage increase of all commuting modes tracked by the 2000 Census and the 2008-2012 American Community Survey.
"In recent years, many communities have taken steps to support more transportation options, such as bicycling and walking," said Brian McKenzie, a Census Bureau sociologist and the report's author. "For example, many cities have invested in bike share programs, bike lanes and more pedestrian-friendly streets."
While bicyclists account for just 0.6 percent of all commuters, some of the nation's largest cities have more than doubled their rates since 2000. Portland, Ore., had the highest bicycle commuting rate, at 6.1%, up from 1.8% in 2000. In Minneapolis, the rate increased from 1.9% to 4.1%.
The report also looks at the number of people who walk to work. After steadily decreasing since 1980, the percent of people who walk to work has stabilized since 2000. In 1980, 5.6% of workers walked to work, and that rate declined to 2.9% by 2000. However, in the 2008-2012 period, the rate of walkers remained statistically unchanged from 2000. Among larger cities, Boston had the highest rate of walking to work at 15.1%.
The report, "Modes Less Traveled — Bicycling and Walking to Work in the United States: 2008-2012," highlights the trends and socio-economic and geographic differences between motorized and nonmotorized commutes.
Biking to Work Highlights:
- The West had the highest rate of biking to work at 1.1%, and the South had the lowest rate at 0.3%.
- Among large cities, Portland, Ore., had the highest bicycle-commuting rate at 6.1%.
- The median commute time for those who bike to work was about 19.3 minutes.
- Men were more likely to bike to work than women were. The rate of bicycle commuting for men was more than double that of women, 0.8% compared with 0.3%.
- Those with a graduate or professional degree or higher and those with less than a high school degree had the highest rates of biking to work, at 0.9% and 0.7%, respectively.
- 1.5% of those with an income of $10,000 or less commuted to work by bicycle, the highest rate of bicycle commuting by any income category.
- African-Americans had the lowest rate of biking to work at 0.3%, compared with some other race or two or more races who had the highest rate at 0.8%.
Walking to Work Highlights:
- The Northeast showed the highest rate of walking to work at 4.7% of workers. Several of the places with high rates were "college towns," including Ithaca, N.Y., where about 42.4% walked to work. The South had the lowest rate at 1.8%. Among large cities, Boston was one of the highest walking-to-work cities at 15.1%.
- Workers living in core cities walked to work at a rate of 4.3%, compared with 2.4% for workers in suburbs.
- The median commute time for those who walk to work was 11.5 minutes, and they left their home at later hours than other modes.
- Men walked to work at a rate of 2.9% compared with 2.8% for women.
- Those with less than a high school degree had the highest rate of walking to work at 3.7%, followed by those with graduate or professional degrees at 2.7%.
- 8.2% of those with an income of $10,000 or less walked to work, the highest rate of walking to work by any income category.
- Asians and workers of some other race or two or more races had the highest rate of walking to work at 4.0% and 4.2%, respectively.
Related Stories
Sponsored | BD+C University Course | Jan 12, 2022
Total steel project performance
This instructor-led video course discusses actual project scenarios where collaborative steel joist and deck design have reduced total-project costs. In an era when incomplete structural drawings are a growing concern for our industry, the course reveals hidden costs and risks that can be avoided.
University Buildings | Jan 11, 2022
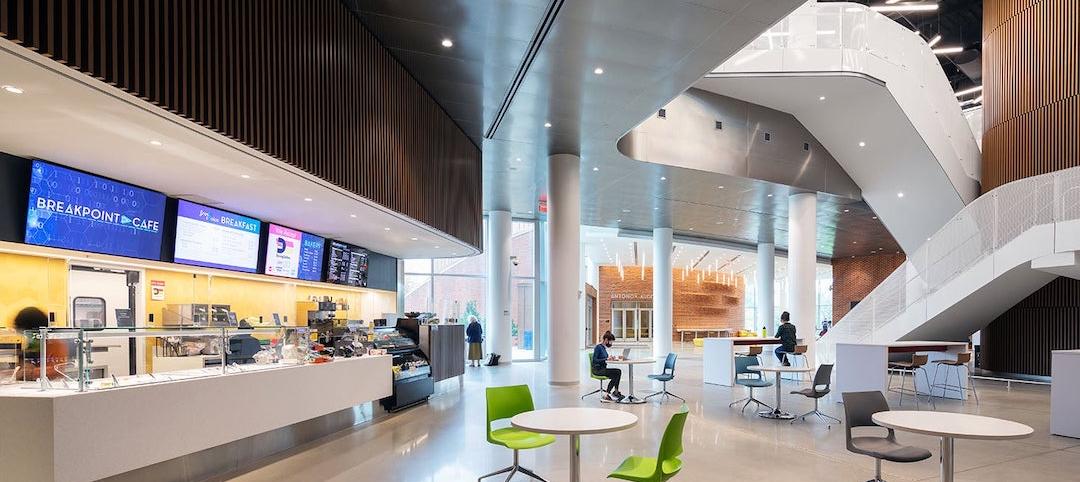
Designing for health sciences education: supporting student well-being
While student and faculty health and well-being should be a top priority in all spaces within educational facilities, this article will highlight some key considerations.

Green | Jan 10, 2022
The future of regenerative building is performance-based
Why measuring performance results is so critical, but also easier said than done.

Senior Living Design | Jan 5, 2022
Top Senior Living Facility Design and Construction Firms
Perkins Eastman, Kimley-Horn, WSP USA, Whiting-Turner Contracting Co., and Ryan Companies US top BD+C's rankings of the nation's largest senior living sector architecture, engineering, and construction firms, as reported in the 2021 Giants 400 Report.

Giants 400 | Jan 3, 2022
2021 Government Sector Giants: Top architecture, engineering, and construction firms in the U.S. government buildings sector
Stantec, Jacobs, Turner Construction, and Hensel Phelps top BD+C's rankings of the nation's largest government sector architecture, engineering, and construction firms, as reported in the 2021 Giants 400 Report.
Architects | Dec 20, 2021
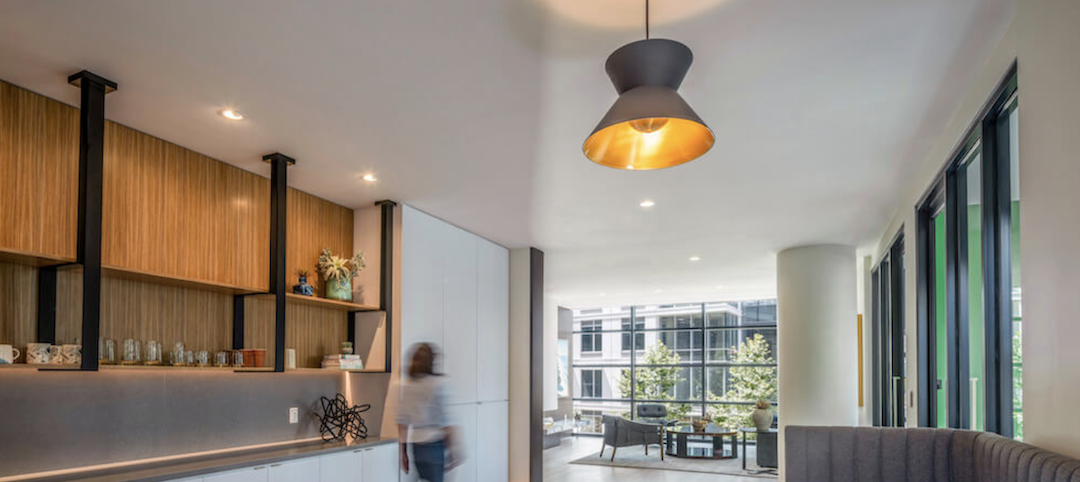
Digital nomads are influencing design
As our spaces continue to adapt to our future needs, we’ll likely see more collaborative, communal zones where people can relax, shop, and work.

Architects | Dec 17, 2021
What I wish I had learned in architecture school
Bradford Perkins, FAIA, offers a 3-point plan for upgrading architecture education.
Urban Planning | Dec 15, 2021
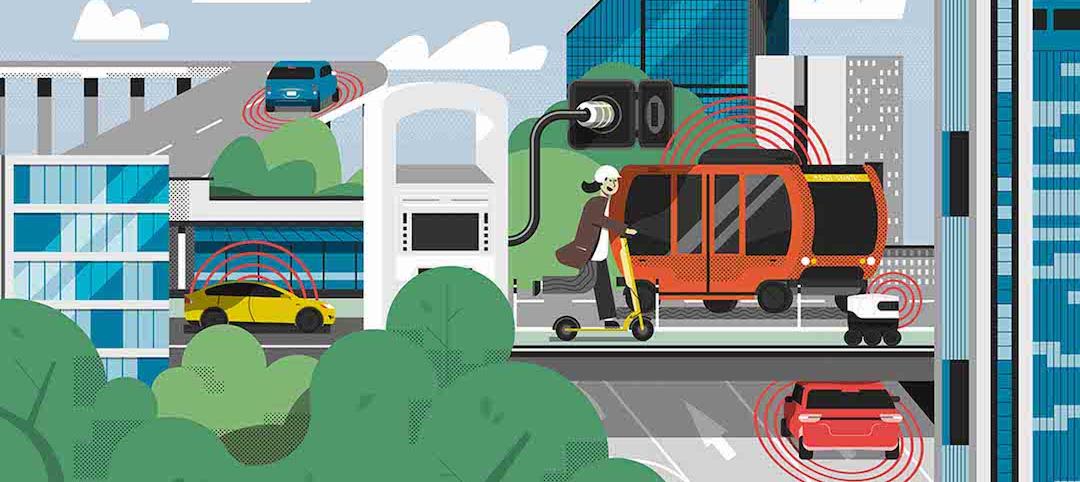
EV is the bridge to transit’s AV revolution—and now is the time to start building it
Thinking holistically about a technology-enabled customer experience will make transit a mode of choice for more people.

Sports and Recreational Facilities | Dec 15, 2021
Trends in sports stadium construction, with Turner Construction's Dewey Newton
Turner Construction's Dewey Newton discusses trends in sports stadium renovation and construction with BD+C's John Caulfield. Newton is a Senior Vice President who heads up Turner Construction’s Sports Group.

Healthcare Facilities | Dec 15, 2021
COVID-19 has altered the speed and design of healthcare projects, perhaps irrevocably
Healthcare clients want their projects up and running quicker, a task made more complicated by the shortage of skilled labor in many markets.


