


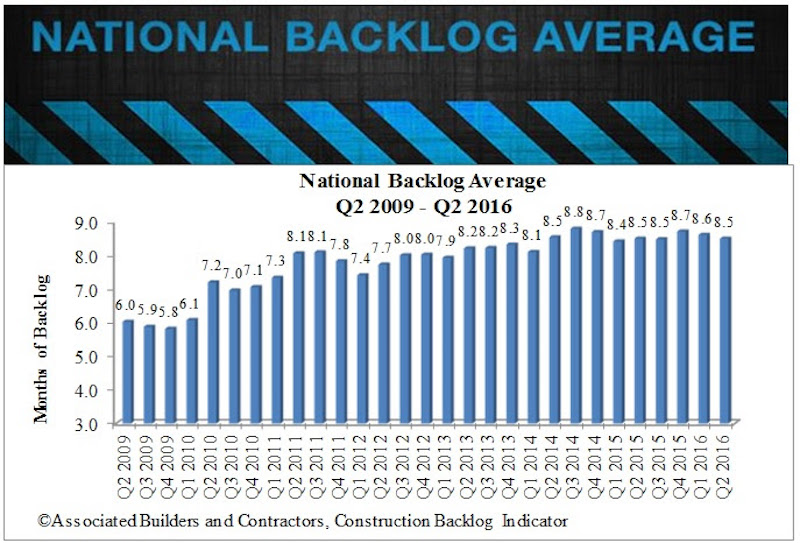
Construction backlog for large contractors reached a new peak of 14.06 months during the second quarter of 2016 according to the Associated Builders and Contractors (ABC) Construction Backlog Indicator (CBI) released today. The new high for companies with annual revenue above $100 million shattered the previous high of 12.25 months for any revenue segment, which was recorded in the first quarter of 2016 and second quarter of 2013.
Nationally, average backlog fell to 8.5 months during the second quarter, down 1.6 percent from the prior quarter. CBI remained virtually unchanged on a year-over-year basis, signaling that growth in the nation’s nonresidential construction industry is slowing.
“There are a number of potential explanatory factors regarding the lack of growth in backlog, the most obvious of which is the continued slow growth of the economy,” says ABC Chief Economist Anirban Basu. “Financial regulators have begun to express growing concern regarding possible bubbles forming in certain real estate segments in certain cities, which may have rendered the developer financing environment somewhat more challenging. A slowdown in business investment, including in energy-related sectors, has undoubtedly also played a role.”
Regional Highlights
- Contractors in the South have reported average backlog in excess of 10 months for fourth consecutive quarters. Backlog in the South has never been higher than it has been over the past year, with significant activity reported in several South Carolina, Georgia and Florida markets.
- Backlog in the West expanded during the second quarter, with contractors in Seattle, Portland, Boise and in a number of California markets reporting still expanding backlog. Many contractors report both more private and public contracting as local governments scramble to accommodate rapidly expanding populations.
- Backlog in the Middle States hit the eight-month threshold, the highest level recorded in the history of the series. The expansion of the U.S. auto sector appears to be disproportionately responsible.
Sector Highlights
- Average backlog in the heavy industrial category rose to 7.4 months during the second quarter, the highest level on record. The U.S. auto industry appears to be largely responsible, with contractors in Mississippi, Tennessee, Indiana and other significant auto supply markets reported stable to rising backlog levels.
- Backlog in the infrastructure category declined for a second consecutive quarter during the second quarter, but remains well above 10 months. Only on two occasions have infrastructure contractors reported higher backlog. However, the impact of the passage of a federal highway bill last year has been generally less than anticipated.
Highlights by Company Size
- Backlog for firms with revenue less than $30 million—the smallest delineation—declined by 0.1 months in the second quarter and has now fallen during five of the previous seven quarters. These firms are among the most likely to be limited by skilled labor shortfalls, which prevent them from effectively bidding on larger projects, thereby setting the stage for gradual declines in backlog.
- A softening of backlog in the northeast helps to explain the year-over-year decline in backlog among firms in the $30-$100 million annual revenue category.
- Large industrial projects represent a primarily explanatory factor behind the surge in backlog among the largest construction firms. Large-scale industrial projects have been reported in Texas, Louisiana and other markets, setting the stage for stable to rising construction investment in those markets. Over the past two years, construction volumes have been falling in a number of Texas and Louisiana markets, likely attributable to diminished oil and natural gas prices.
Related Stories
Industry Research | Feb 8, 2024
New multifamily development in 2023 exceeded expectations
Despite a problematic financing environment, 2023 multifamily construction starts held up “remarkably well” according to the latest Yardi Matrix report.

Market Data | Feb 7, 2024
New download: BD+C's February 2024 Market Intelligence Report
Building Design+Construction's monthly Market Intelligence Report offers a snapshot of the health of the U.S. building construction industry, including the commercial, multifamily, institutional, and industrial building sectors. This report tracks the latest metrics related to construction spending, demand for design services, contractor backlogs, and material price trends.

Industry Research | Jan 31, 2024
ASID identifies 11 design trends coming in 2024
The Trends Outlook Report by the American Society of Interior Designers (ASID) is the first of a three-part outlook series on interior design. This design trends report demonstrates the importance of connection and authenticity.

Apartments | Jan 26, 2024
New apartment supply: Top 5 metros delivering in 2024
Nationally, the total new apartment supply amounts to around 1.4 million units—well exceeding the apartment development historical average of 980,000 units.

Self-Storage Facilities | Jan 25, 2024
One-quarter of self-storage renters are Millennials
Interest in self-storage has increased in over 75% of the top metros according to the latest StorageCafe survey of self-storage preferences. Today, Millennials make up 25% of all self-storage renters.

Industry Research | Jan 23, 2024
Leading economists forecast 4% growth in construction spending for nonresidential buildings in 2024
Spending on nonresidential buildings will see a modest 4% increase in 2024, after increasing by more than 20% last year according to The American Institute of Architects’ latest Consensus Construction Forecast. The pace will slow to just over 1% growth in 2025, a marked difference from the strong performance in 2023.

Construction Costs | Jan 22, 2024
Construction material prices continue to normalize despite ongoing challenges
Gordian’s most recent Quarterly Construction Cost Insights Report for Q4 2023 describes an industry still attempting to recover from the impact of COVID. This was complicated by inflation, weather, and geopolitical factors that resulted in widespread pricing adjustments throughout the construction materials industries.

Hotel Facilities | Jan 22, 2024
U.S. hotel construction is booming, with a record-high 5,964 projects in the pipeline
The hotel construction pipeline hit record project counts at Q4, with the addition of 260 projects and 21,287 rooms over last quarter, according to Lodging Econometrics.

Multifamily Housing | Jan 15, 2024
Multifamily rent growth rate unchanged at 0.3%
The National Multifamily Report by Yardi Matrix highlights the highs and lows of the multifamily market in 2023. Despite strong demand, rent growth remained unchanged at 0.3 percent.

Self-Storage Facilities | Jan 5, 2024
The state of self-storage in early 2024
As the housing market cools down, storage facilities suffer from lower occupancy and falling rates, according to the December 2023 Yardi Matrix National Self Storage Report.


