


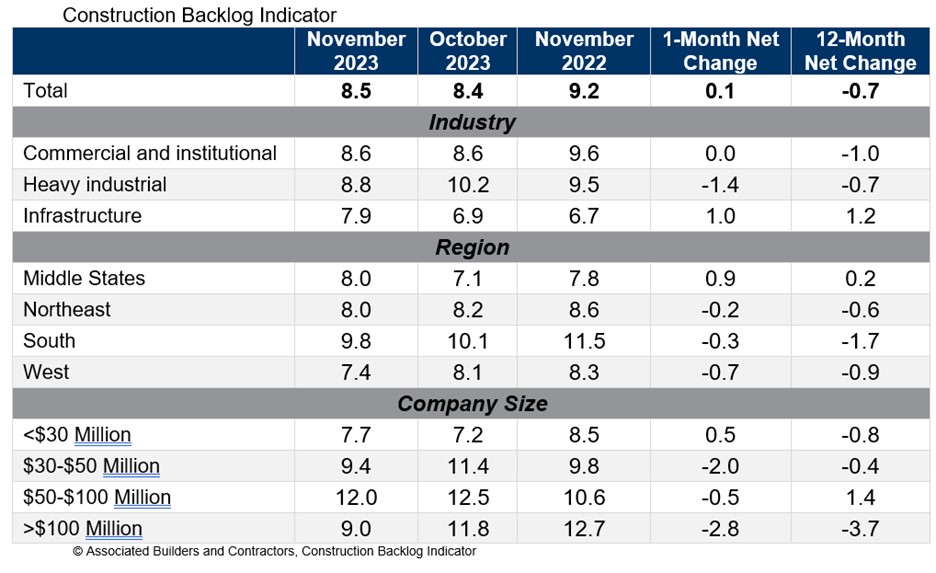
Associated Builders and Contractors reported today that its Construction Backlog Indicator inched up to 8.5 months in November from 8.4 months in October, according to an ABC member survey conducted Nov. 20 to Dec. 4. The reading is down 0.7 months from November 2022.
View ABC’s Construction Backlog Indicator and Construction Confidence Index tables for November. View the full Construction Backlog Indicator and Construction Confidence Index data series.
Despite the monthly increase, backlog is currently 0.8 months lower than at July’s cyclical peak. The sharpest declines over that span occurred among contractors with more than $100 million in annual revenues, who collectively reported fewer than 10 months of backlog in November for the first time since the second quarter of 2018.
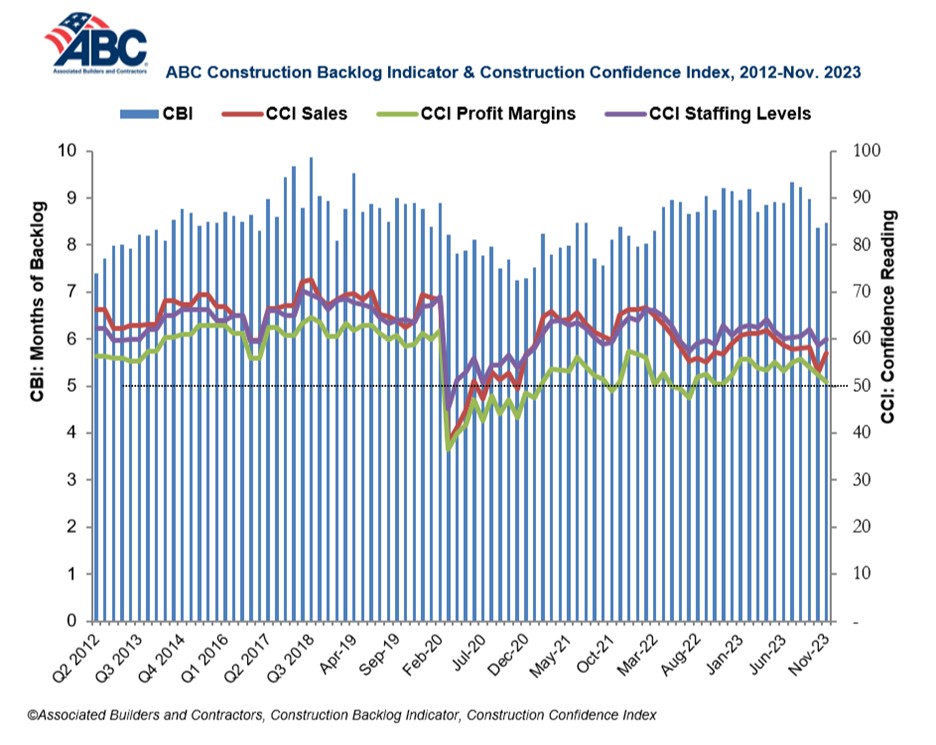
ABC’s Construction Confidence Index readings for sales and staffing levels increased in November, while the reading for profit margins fell. All three readings remain above the threshold of 50, indicating expectations for growth over the next six months.
“A growing number of contractors are reporting declines in backlog,” said ABC Chief Economist Anirban Basu. “The interest rate hikes implemented by the Federal Reserve appear to be making more of a mark on the economy. Not only has the cost of capital risen over the past 20+ months, but credit conditions are also tightening, rendering project financing even more challenging.
“The good news is that certain interest rates have begun to fall in anticipation of Federal Reserve rate cuts next year, perhaps as early as the first quarter,” said Basu. “Still, 2024 is poised to be weaker from a construction demand perspective for many firms, especially those that depend heavily on private developers. Those operating in public construction and/or industrial segments should meet with less resistance on average.”
Related Stories

Building Team Awards | May 25, 2016
New health center campus provides affordable care for thousands of Northern Californians
The 38,000-sf, two-level John & Susan Sobrato Campus in Palo Alto is expected to serve 25,000 patients a year by the end of the decade.

Building Team Awards | May 24, 2016
Los Angeles bus depot squeezes the most from a tight site
The Building Team for the MTA Division 13 Bus Operations and Maintenance Facility fit 12 acres’ worth of programming in a multi-level structure on a 4.8-acre site.

Building Team Awards | May 23, 2016
'Greenest ballpark' proves a winner for St. Paul Saints
Solar arrays, a public art courtyard, and a picnic-friendly “park within a park" make the 7,210-seat CHS Field the first ballpark to meet Minnesota sustainable building standards.

Building Team Awards | May 19, 2016
Chinatown library unites and serves two emerging Chicago neighborhoods
The 16,000-sf, pebble-shaped Chinatown Branch Library was built at the intersection of new and old Chinatown neighborhoods. The goal is for the building to unite the communities and serve as a catalyst for the developing area.

Building Team Awards | May 19, 2016
NYC subway station lights the way for 300,000 riders a day
Fulton Center, which handles 85% of the riders coming to Lower Manhattan, is like no other station in the city’s vast underground transit web—and that’s a good thing.

Market Data | May 17, 2016
Modest growth for AIA’s Architecture Billings Index in April
The American Institute of Architects reported the April ABI score was 50.6, down from the mark of 51.9 in the previous month. This score still reflects an increase in design services.

Retail Centers | May 10, 2016
5 factors guiding restaurant design
Restaurants are more than just places to eat. They are comprising town centers and playing into the future of brick-and-mortar retail.

AEC Tech | May 9, 2016
Is the nation’s grand tech boom really an innovation funk?
Despite popular belief, the country is not in a great age of technological and digital innovation, at least when compared to the last great innovation era (1870-1970).

Big Data | May 5, 2016
Demand for data integration technologies for buildings is expected to soar over the next decade
A Navigant Research report takes a deeper dive to examine where demand will be strongest by region and building type.

Urban Planning | May 4, 2016
Brookings report details how different industries innovate
In the new report, “How Firms Learn: Industry Specific Strategies for Urban Economies,” Brookings' Scott Andes examines how manufacturing and software services firms develop new products, processes, and ideas.


