


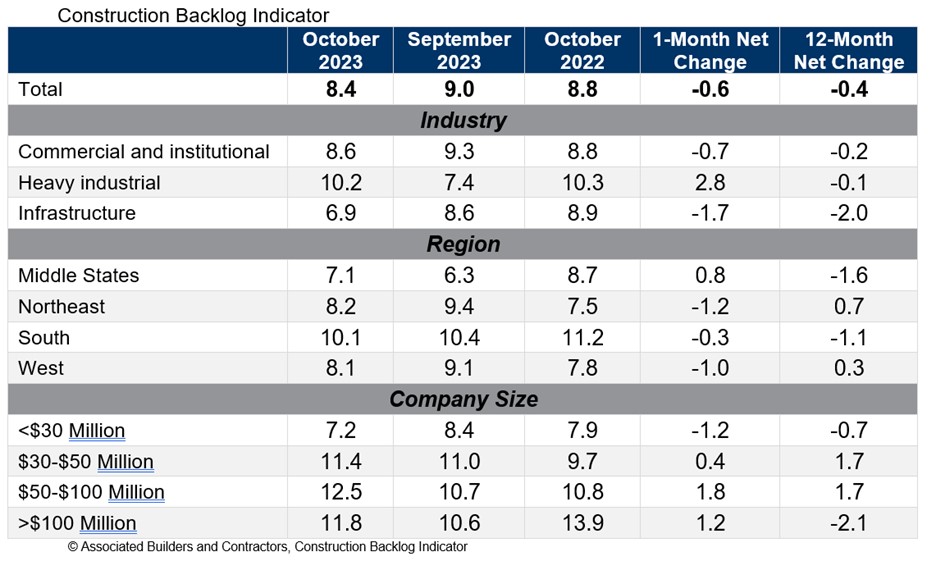
Associated Builders and Contractors reported that its Construction Backlog Indicator declined to 8.4 months in October from 9.0 months in September, according to an ABC member survey conducted from Oct. 19 to Nov. 2. The reading is down 0.4 months from October 2022.
Backlog now stands at its lowest level since the first quarter of 2022. Declines were concentrated among the smallest contractors, those with less than $30 million in annual revenues. All three other revenue categories experienced an increase in backlog in October.
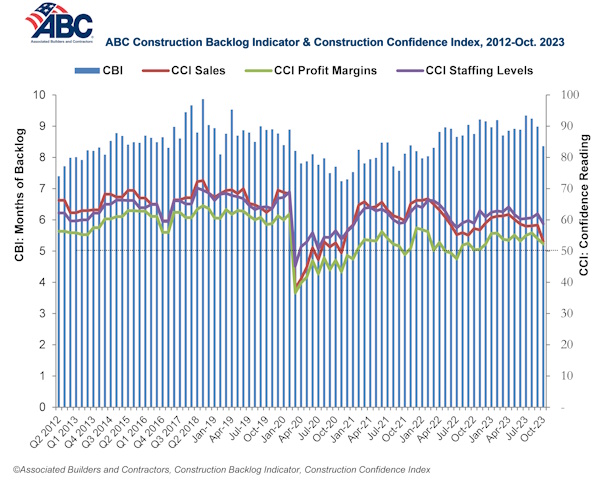
ABC’s Construction Confidence Index readings for sales, staffing levels and profit margins fell in October. All three readings remain above the threshold of 50, indicating expectations for growth over the next six months.
“While larger contractors continue to disproportionately benefit from a bevy of megaprojects around the nation, many smaller contractors are feeling the sting of weaker economic fundamentals in struggling commercial real estate segments,” said ABC Chief Economist Anirban Basu. “Smaller contractors are often the ones most dependent on developer-driven activity. With developers facing both higher borrowing costs and greater difficulty lining up project financing, backlog among some contractors is beginning to dissipate.
“This is precisely what ABC economists predicted,” said Basu. “The vast majority of contractors could boast healthy backlog, especially those working in the manufacturing/industrial, infrastructure, data center and health care segments. But those tied to the office, shopping center and multifamily markets are likely experiencing difficulty lining up work. This helps explain declines in the readings for ABC’s Construction Confidence Index in all three dimensions: sales, employment and margins. Each of these readings, however, remains above 50, suggesting that, while industry growth is softening, it has yet to enter contractionary territory.”
Related Stories

Market Data | Aug 28, 2017
U.S. hotel construction pipeline is up 7% year-over-year
For the economy, the rate of growth may be low but it’s running on all cylinders.

Market Data | Aug 23, 2017
Architecture Billings Index growth moderates
“The July figures show the continuation of healthy trends in the construction sector of our economy,” said AIA Chief Economist, Kermit Baker.

Architects | Aug 21, 2017
AIA: Architectural salaries exceed gains in the broader economy
AIA’s latest compensation report finds average compensation for staff positions up 2.8% from early 2015.

Market Data | Aug 20, 2017
Some suburban office markets are holding their own against corporate exodus to cities
An analysis of mortgage-backed loans suggests that demand remains relatively steady.
Market Data | Aug 17, 2017
Marcum Commercial Construction Index reports second quarter spending increase in commercial and office construction
Spending in all 12 of the remaining nonresidential construction subsectors retreated on both an annualized and monthly basis.

Industry Research | Aug 11, 2017
NCARB releases latest data on architectural education, licensure, and diversity
On average, becoming an architect takes 12.5 years—from the time a student enrolls in school to the moment they receive a license.

Market Data | Aug 4, 2017
U.S. grand total construction starts growth projection revised slightly downward
ConstructConnect’s quarterly report shows courthouses and sports stadiums to end 2017 with a flourish.

Market Data | Aug 2, 2017
Nonresidential Construction Spending falls in June, driven by public sector
June’s weak construction spending report can be largely attributed to the public sector.

Market Data | Jul 31, 2017
U.S. economic growth accelerates in second quarter; Nonresidential fixed investment maintains momentum
Nonresidential fixed investment, a category of GDP embodying nonresidential construction activity, expanded at a 5.2% seasonally adjusted annual rate.

Multifamily Housing | Jul 27, 2017
Apartment market index: Business conditions soften, but still solid
Despite some softness at the high end of the apartment market, demand for apartments will continue to be substantial for years to come, according to the National Multifamily Housing Council.


