


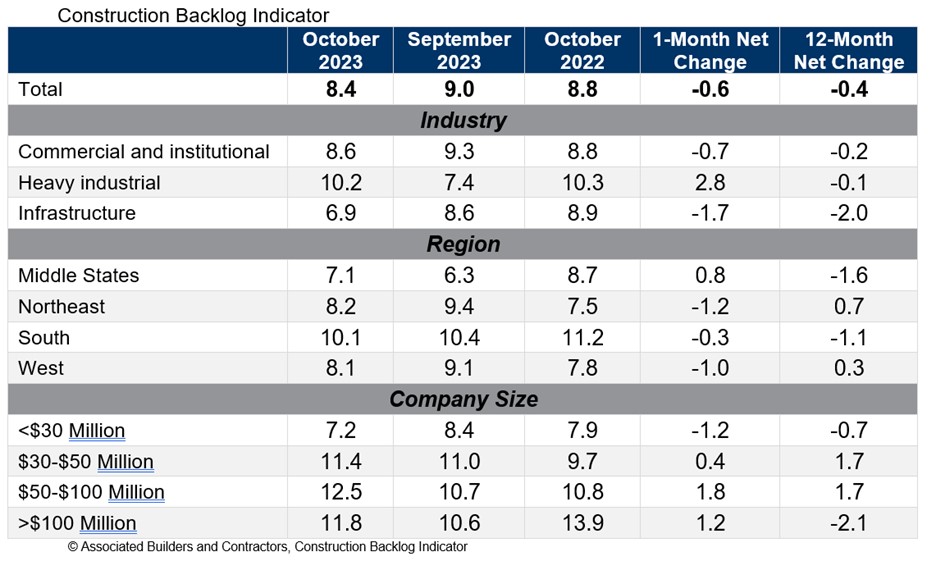
Associated Builders and Contractors reported that its Construction Backlog Indicator declined to 8.4 months in October from 9.0 months in September, according to an ABC member survey conducted from Oct. 19 to Nov. 2. The reading is down 0.4 months from October 2022.
Backlog now stands at its lowest level since the first quarter of 2022. Declines were concentrated among the smallest contractors, those with less than $30 million in annual revenues. All three other revenue categories experienced an increase in backlog in October.
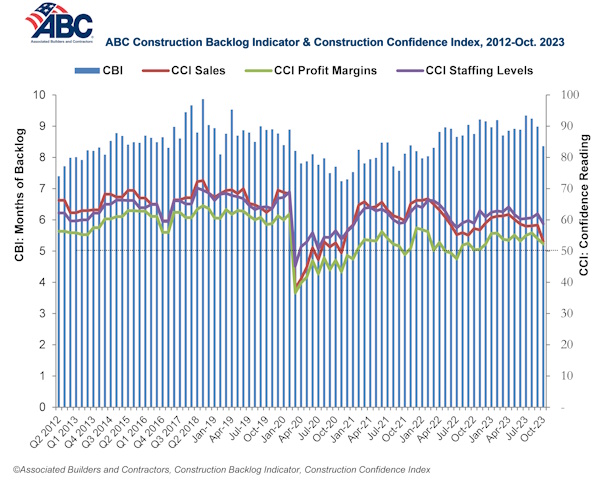
ABC’s Construction Confidence Index readings for sales, staffing levels and profit margins fell in October. All three readings remain above the threshold of 50, indicating expectations for growth over the next six months.
“While larger contractors continue to disproportionately benefit from a bevy of megaprojects around the nation, many smaller contractors are feeling the sting of weaker economic fundamentals in struggling commercial real estate segments,” said ABC Chief Economist Anirban Basu. “Smaller contractors are often the ones most dependent on developer-driven activity. With developers facing both higher borrowing costs and greater difficulty lining up project financing, backlog among some contractors is beginning to dissipate.
“This is precisely what ABC economists predicted,” said Basu. “The vast majority of contractors could boast healthy backlog, especially those working in the manufacturing/industrial, infrastructure, data center and health care segments. But those tied to the office, shopping center and multifamily markets are likely experiencing difficulty lining up work. This helps explain declines in the readings for ABC’s Construction Confidence Index in all three dimensions: sales, employment and margins. Each of these readings, however, remains above 50, suggesting that, while industry growth is softening, it has yet to enter contractionary territory.”
Related Stories

Market Data | Mar 16, 2020
Grumman/Butkus Associates publishes 2019 edition of Hospital Benchmarking Survey
Report examines electricity, fossil fuel, water/sewer, and carbon footprint.

Market Data | Mar 12, 2020
New study from FMI and Autodesk finds construction organizations with the highest levels of trust perform twice as well on crucial business metrics
Higher levels of trust within organizations and across project teams correlate with increased profit margins, employee retention and repeat business that can all add up to millions of dollars of profitability annually.

Market Data | Mar 11, 2020
The global hotel construction pipeline hits record high at 2019 year-end
Projects currently under construction stand at a record 991 projects with 224,354 rooms.

Market Data | Mar 6, 2020
Construction employment increases by 43,000 in February and 223,000 over 12 months
Average hourly earnings in construction top private sector average by 9.9% as construction firms continue to boost pay and benefits in effort to attract and retain qualified hourly craft workers.

Market Data | Mar 4, 2020
Nonresidential construction spending attains all-time high in January
Private nonresidential spending rose 0.8% on a monthly basis and is up 0.5% compared to the same time last year.

Market Data | Feb 21, 2020
Construction contractor confidence remains steady
70% of contractors expect their sales to increase over the first half of 2020.

Market Data | Feb 20, 2020
U.S. multifamily market gains despite seasonal lull
The economy’s steady growth buoys prospects for continued strong performance.

Market Data | Feb 19, 2020
Architecture billings continue growth into 2020
Demand for design services increases across all building sectors.

Market Data | Feb 5, 2020
Construction employment increases in 211 out of 358 metro areas from December 2018 to 2019
Dallas-Plano-Irving, Texas and Kansas City have largest gains; New York City and Fairbanks, Alaska lag the most as labor shortages likely kept firms in many areas from adding even more workers.

Market Data | Feb 4, 2020
Construction spending dips in December as nonresidential losses offset housing pickup
Homebuilding strengthens but infrastructure and other nonresidential spending fades in recent months, reversing pattern in early 2019.


