


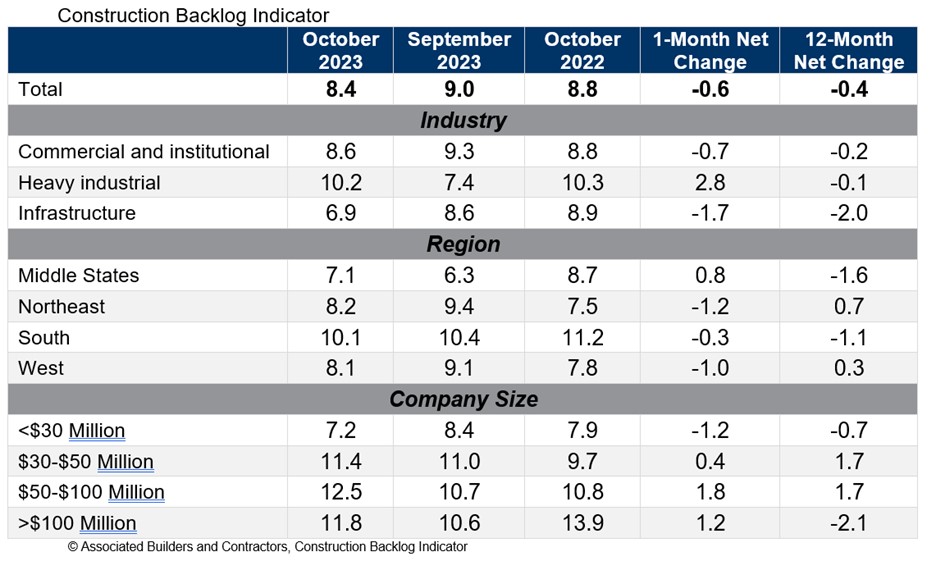
Associated Builders and Contractors reported that its Construction Backlog Indicator declined to 8.4 months in October from 9.0 months in September, according to an ABC member survey conducted from Oct. 19 to Nov. 2. The reading is down 0.4 months from October 2022.
Backlog now stands at its lowest level since the first quarter of 2022. Declines were concentrated among the smallest contractors, those with less than $30 million in annual revenues. All three other revenue categories experienced an increase in backlog in October.
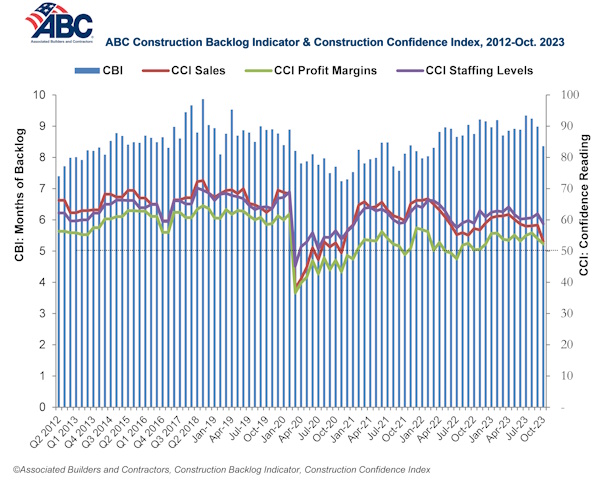
ABC’s Construction Confidence Index readings for sales, staffing levels and profit margins fell in October. All three readings remain above the threshold of 50, indicating expectations for growth over the next six months.
“While larger contractors continue to disproportionately benefit from a bevy of megaprojects around the nation, many smaller contractors are feeling the sting of weaker economic fundamentals in struggling commercial real estate segments,” said ABC Chief Economist Anirban Basu. “Smaller contractors are often the ones most dependent on developer-driven activity. With developers facing both higher borrowing costs and greater difficulty lining up project financing, backlog among some contractors is beginning to dissipate.
“This is precisely what ABC economists predicted,” said Basu. “The vast majority of contractors could boast healthy backlog, especially those working in the manufacturing/industrial, infrastructure, data center and health care segments. But those tied to the office, shopping center and multifamily markets are likely experiencing difficulty lining up work. This helps explain declines in the readings for ABC’s Construction Confidence Index in all three dimensions: sales, employment and margins. Each of these readings, however, remains above 50, suggesting that, while industry growth is softening, it has yet to enter contractionary territory.”
Related Stories

Market Data | Jun 17, 2021
Commercial construction contractors upbeat on outlook despite worsening material shortages, worker shortages
88% indicate difficulty in finding skilled workers; of those, 35% have turned down work because of it.

Market Data | Jun 16, 2021
Construction input prices rise 4.6% in May; softwood lumber prices up 154% from a year ago
Construction input prices are 24.3% higher than a year ago, while nonresidential construction input prices increased 23.9% over that span.

Market Data | Jun 16, 2021
Producer prices for construction materials and services jump 24% over 12 months
The 24.3% increase in prices for materials used in construction from May 2020 to last month was nearly twice as great as in any previous year

Market Data | Jun 15, 2021
ABC’s Construction Backlog inches higher in May
Materials and labor shortages suppress contractor confidence.

Market Data | Jun 11, 2021
The countries with the most green buildings
As the country that set up the LEED initiative, the US is a natural leader in constructing green buildings.

Market Data | Jun 7, 2021
Construction employment slips by 20,000 in May
Seasonally adjusted construction employment in May totaled 7,423,000.

Market Data | Jun 2, 2021
Construction employment in April lags pre-covid February 2020 level in 107 metro areas
Houston-The Woodlands-Sugar Land and Odessa, Texas have worst 14-month construction job losses.

Market Data | Jun 1, 2021
Nonresidential construction spending decreases 0.5% in April
Spending was down on a monthly basis in nine of 16 nonresidential subcategories.

Market Data | Jun 1, 2021
Nonresidential construction outlays drop in April to two-year low
Public and private work declines amid supply-chain woes, soaring costs.

Market Data | May 24, 2021
Construction employment in April remains below pre-pandemic peak in 36 states and D.C.
Texas and Louisiana have worst job losses since February 2020, while Utah and Idaho are the top gainers.


