


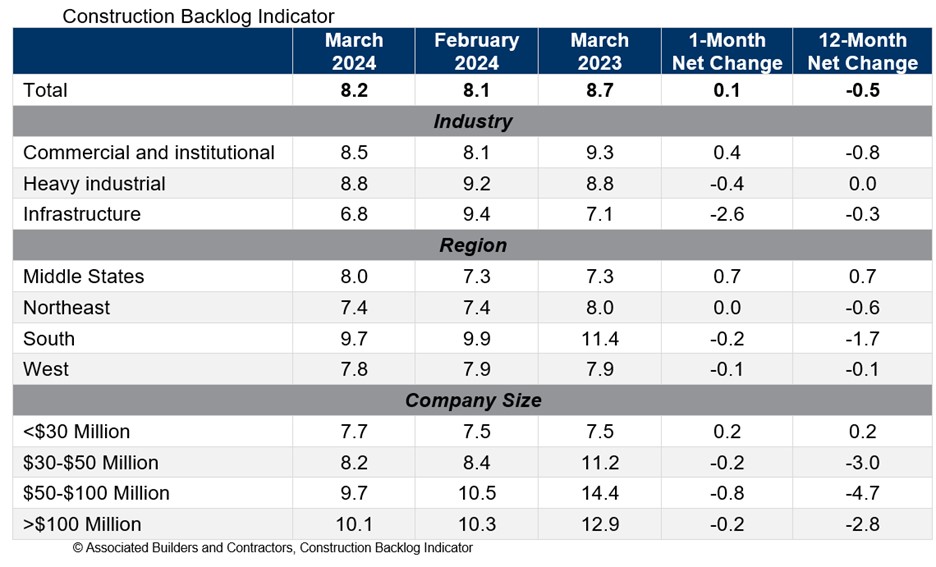
Associated Builders and Contractors reported today that its Construction Backlog Indicator increased to 8.2 months in March from 8.1 months in February, according to an ABC member survey conducted March 20 to April 3. The reading is down 0.5 months from March 2023.
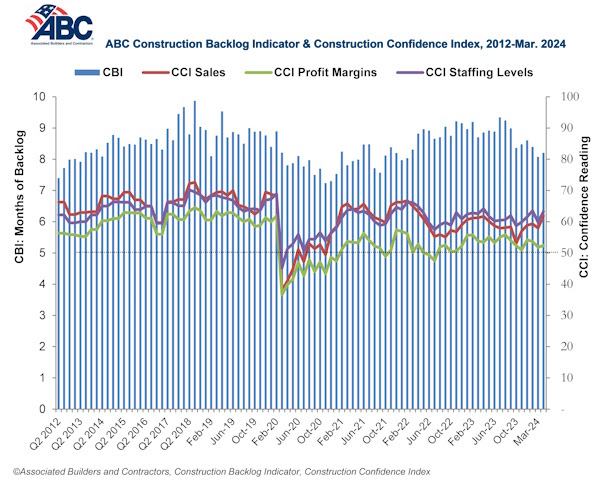
View ABC’s Construction Backlog Indicator and Construction Confidence Index tables for March. View the full Construction Backlog Indicator and Construction Confidence Index data series.
Backlog is down over the past year for every region except for the Middle States, which now has the second largest backlog of any region. The South continues to have the largest backlog despite a large decline over the past year.
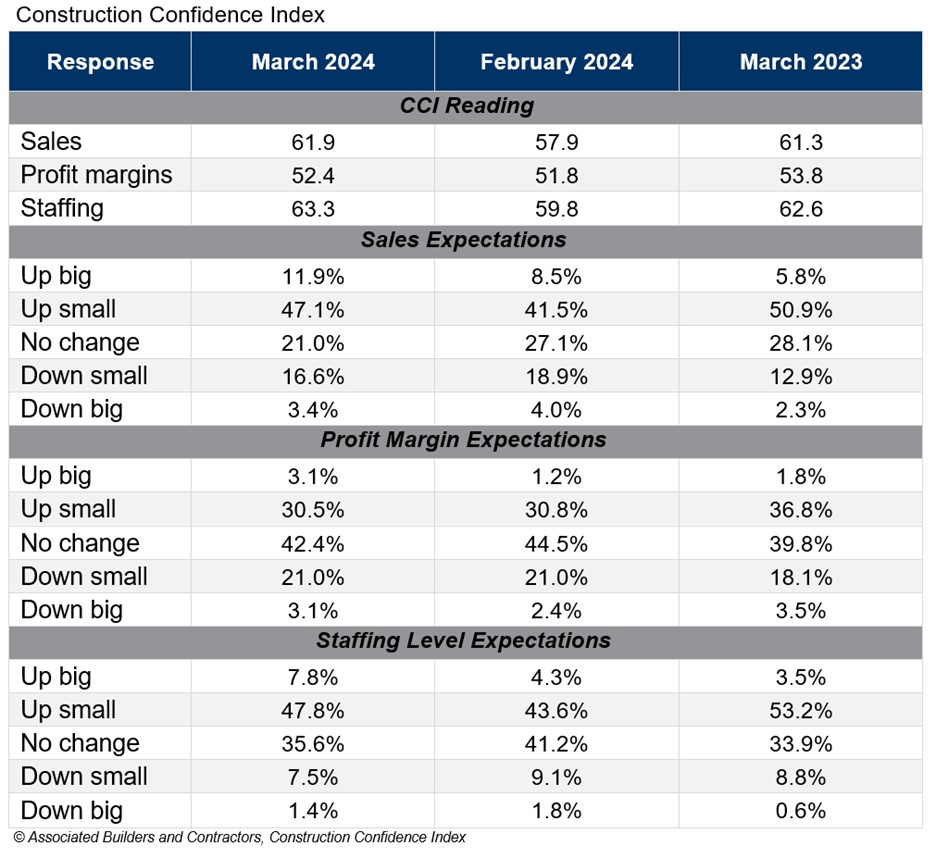
ABC’s Construction Confidence Index readings for sales, profit margins and staffing levels increased in March. All three readings remain above the threshold of 50, indicating expectations for growth over the next six months.
“Given headwinds such as high borrowing costs, emerging supply chain issues, project financing challenges and labor shortages, the persistent optimism among nonresidential construction contractors is astonishing,” said ABC Chief Economist Anirban Basu. “Last month, contractors reported rising backlog and greater conviction regarding likely growth in sales, employment and profit margins.
“While certain readings are below year-ago levels, there was broad-based improvement in March,” said Basu. “For instance, in the category of profit margins, 32% of those surveyed in February expected improvement over the next six months. That share rose to nearly 34% in March, with only 24% hinting at near-term margin compression. That indicates that though costs of delivering construction services continue to rise, contractors collectively enjoy enough pricing power to support stable to rising margins. If interest rates begin to decline during the summer as is widely expected, confidence is likely to climb further.”
Note: The reference months for the Construction Backlog Indicator and Construction Confidence Index data series were revised on May 12, 2020, to better reflect the survey period. CBI quantifies the previous month's work under contract based on the latest financials available, while CCI measures contractors' outlook for the next six months. View the methodology for both indicators.
Related Stories

Market Data | May 2, 2017
Nonresidential Spending loses steam after strong start to year
Spending in the segment totaled $708.6 billion on a seasonally adjusted, annualized basis.

Market Data | May 1, 2017
Nonresidential Fixed Investment surges despite sluggish economic in first quarter
Real gross domestic product (GDP) expanded 0.7 percent on a seasonally adjusted annualized rate during the first three months of the year.

Industry Research | Apr 28, 2017
A/E Industry lacks planning, but still spending large on hiring
The average 200-person A/E Firm is spending $200,000 on hiring, and not budgeting at all.

Market Data | Apr 19, 2017
Architecture Billings Index continues to strengthen
Balanced growth results in billings gains in all regions.

Market Data | Apr 13, 2017
2016’s top 10 states for commercial development
Three new states creep into the top 10 while first and second place remain unchanged.

Market Data | Apr 6, 2017
Architecture marketing: 5 tools to measure success
We’ve identified five architecture marketing tools that will help your firm evaluate if it’s on the track to more leads, higher growth, and broader brand visibility.

Market Data | Apr 3, 2017
Public nonresidential construction spending rebounds; overall spending unchanged in February
The segment totaled $701.9 billion on a seasonally adjusted annualized rate for the month, marking the seventh consecutive month in which nonresidential spending sat above the $700 billion threshold.

Market Data | Mar 29, 2017
Contractor confidence ends 2016 down but still in positive territory
Although all three diffusion indices in the survey fell by more than five points they remain well above the threshold of 50, which signals that construction activity will continue to be one of the few significant drivers of economic growth.

Market Data | Mar 24, 2017
These are the most and least innovative states for 2017
Connecticut, Virginia, and Maryland are all in the top 10 most innovative states, but none of them were able to claim the number one spot.

Market Data | Mar 22, 2017
After a strong year, construction industry anxious about Washington’s proposed policy shifts
Impacts on labor and materials costs at issue, according to latest JLL report.


