


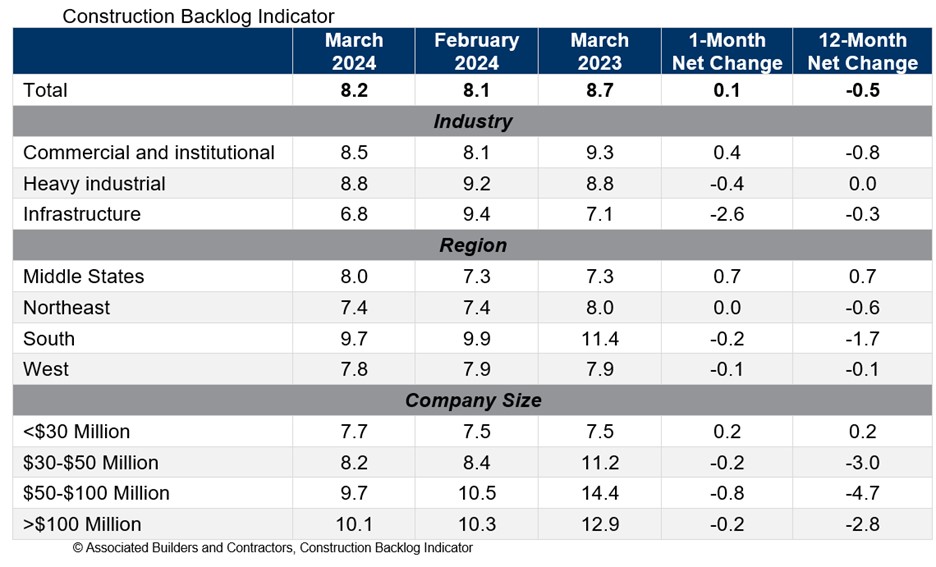
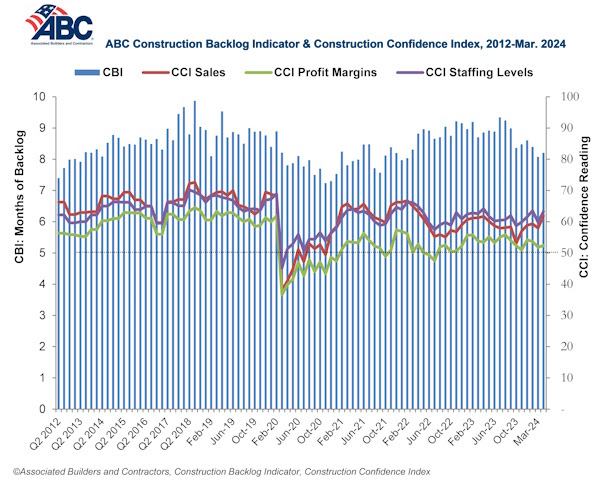
Associated Builders and Contractors reported today that its Construction Backlog Indicator increased to 8.2 months in March from 8.1 months in February, according to an ABC member survey conducted March 20 to April 3. The reading is down 0.5 months from March 2023.
View ABC’s Construction Backlog Indicator and Construction Confidence Index tables for March. View the full Construction Backlog Indicator and Construction Confidence Index data series.
Backlog is down over the past year for every region except for the Middle States, which now has the second largest backlog of any region. The South continues to have the largest backlog despite a large decline over the past year.
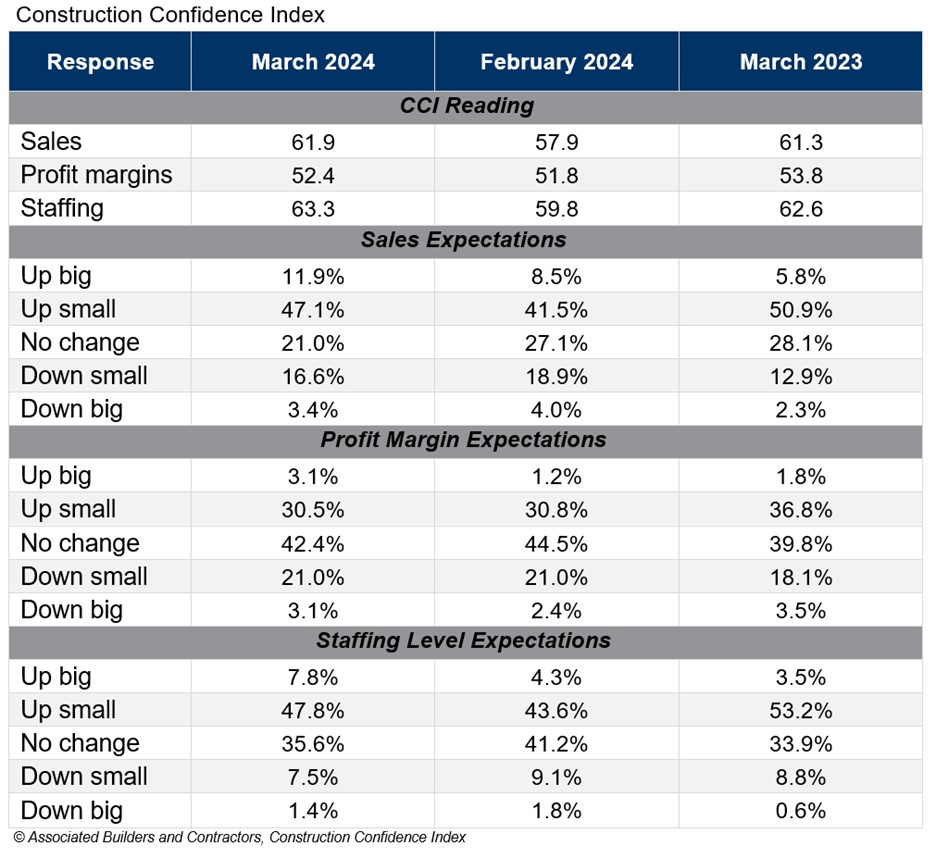
ABC’s Construction Confidence Index readings for sales, profit margins and staffing levels increased in March. All three readings remain above the threshold of 50, indicating expectations for growth over the next six months.
“Given headwinds such as high borrowing costs, emerging supply chain issues, project financing challenges and labor shortages, the persistent optimism among nonresidential construction contractors is astonishing,” said ABC Chief Economist Anirban Basu. “Last month, contractors reported rising backlog and greater conviction regarding likely growth in sales, employment and profit margins.
“While certain readings are below year-ago levels, there was broad-based improvement in March,” said Basu. “For instance, in the category of profit margins, 32% of those surveyed in February expected improvement over the next six months. That share rose to nearly 34% in March, with only 24% hinting at near-term margin compression. That indicates that though costs of delivering construction services continue to rise, contractors collectively enjoy enough pricing power to support stable to rising margins. If interest rates begin to decline during the summer as is widely expected, confidence is likely to climb further.”
Note: The reference months for the Construction Backlog Indicator and Construction Confidence Index data series were revised on May 12, 2020, to better reflect the survey period. CBI quantifies the previous month's work under contract based on the latest financials available, while CCI measures contractors' outlook for the next six months. View the methodology for both indicators.
Related Stories

Market Data | Jun 4, 2018
Nonresidential construction remains unchanged in April
Private sector spending increased 0.8% on a monthly basis and is up 5.3% from a year ago.

Market Data | May 30, 2018
Construction employment increases in 256 metro areas between April 2017 & 2018
Dallas-Plano-Irving and Midland, Texas experience largest year-over-year gains; St. Louis, Mo.-Ill. and Bloomington, Ill. have biggest annual declines in construction employment amid continuing demand.

Market Data | May 29, 2018
America’s fastest-growing cities: San Antonio, Phoenix lead population growth
San Antonio added 24,208 people between July 2016 and July 2017, according to U.S. Census Bureau data.

Market Data | May 25, 2018
Construction group uses mobile technology to make highway work zones safer
Mobile advertising campaign urges drivers who routinely pass through certain work zones to slow down and be alert as new data shows motorists are more likely to be injured than construction workers.

Market Data | May 23, 2018
Architecture firm billings strengthen in April
Firms report solid growth for seven straight months.

Market Data | May 22, 2018
Vacancies stable, rents rising, and pipeline receding, according to Transwestern’s 1Q US Office Market report
The Big Apple still leads the new construction charge.

Market Data | May 18, 2018
Construction employment rises in 38 states and D.C. from April 2017 to April 2018
California & West Virginia have biggest annual job gains, North Dakota has largest decline; California & Louisiana have largest monthly pickup, Indiana & North Dakota lead monthly drops.

High-rise Construction | May 18, 2018
The 100 tallest buildings ever conventionally demolished
The list comes from a recent CTBUH study.

Resiliency | May 17, 2018
Architects brief lawmakers and policy-makers on disaster recovery as hurricane season approaches
Urge senate passage of disaster recovery reform act; Relationship-building with local communities.

Market Data | May 17, 2018
These 25 cities have the highest urban infill development potential
The results stem from a COMMERCIALCafé study.


