


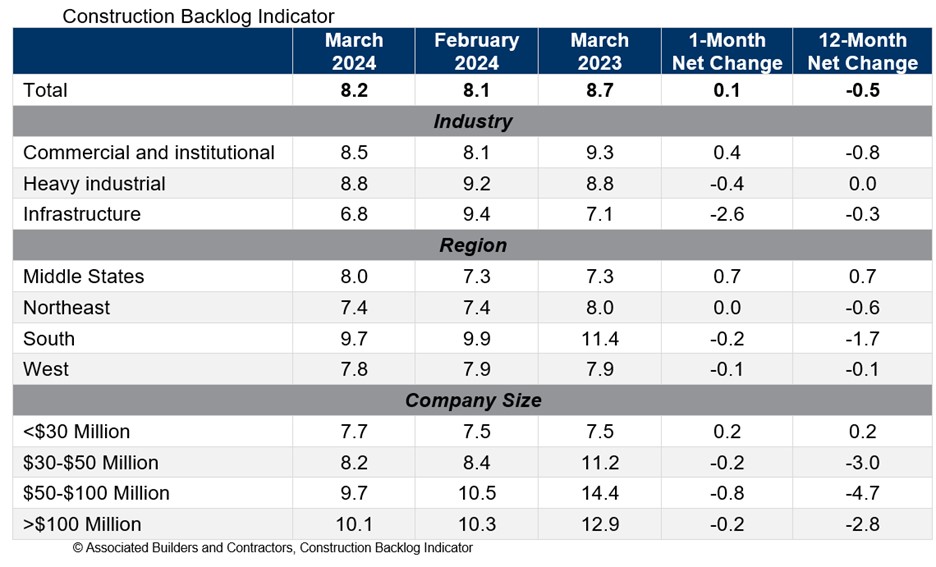
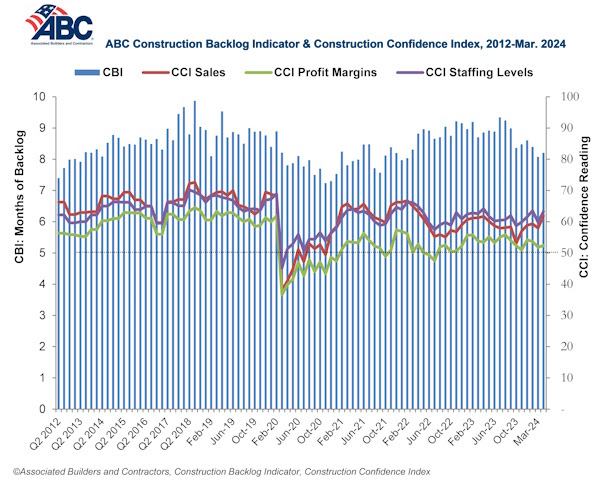
Associated Builders and Contractors reported today that its Construction Backlog Indicator increased to 8.2 months in March from 8.1 months in February, according to an ABC member survey conducted March 20 to April 3. The reading is down 0.5 months from March 2023.
View ABC’s Construction Backlog Indicator and Construction Confidence Index tables for March. View the full Construction Backlog Indicator and Construction Confidence Index data series.
Backlog is down over the past year for every region except for the Middle States, which now has the second largest backlog of any region. The South continues to have the largest backlog despite a large decline over the past year.
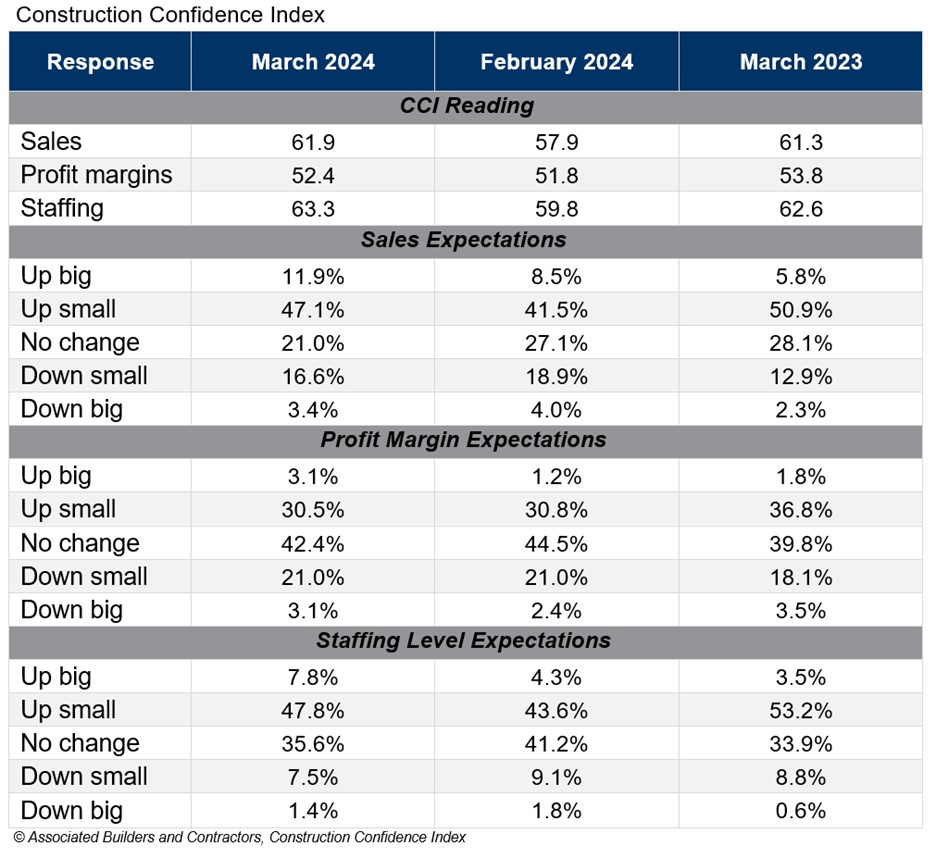
ABC’s Construction Confidence Index readings for sales, profit margins and staffing levels increased in March. All three readings remain above the threshold of 50, indicating expectations for growth over the next six months.
“Given headwinds such as high borrowing costs, emerging supply chain issues, project financing challenges and labor shortages, the persistent optimism among nonresidential construction contractors is astonishing,” said ABC Chief Economist Anirban Basu. “Last month, contractors reported rising backlog and greater conviction regarding likely growth in sales, employment and profit margins.
“While certain readings are below year-ago levels, there was broad-based improvement in March,” said Basu. “For instance, in the category of profit margins, 32% of those surveyed in February expected improvement over the next six months. That share rose to nearly 34% in March, with only 24% hinting at near-term margin compression. That indicates that though costs of delivering construction services continue to rise, contractors collectively enjoy enough pricing power to support stable to rising margins. If interest rates begin to decline during the summer as is widely expected, confidence is likely to climb further.”
Note: The reference months for the Construction Backlog Indicator and Construction Confidence Index data series were revised on May 12, 2020, to better reflect the survey period. CBI quantifies the previous month's work under contract based on the latest financials available, while CCI measures contractors' outlook for the next six months. View the methodology for both indicators.
Related Stories

Market Data | Feb 9, 2021
USGBC top 10 states for LEED in 2020
The Top 10 States for LEED green building is based on gross square feet of certified space per person using 2010 U.S. Census data and includes commercial and institutional projects certified in 2020.

Market Data | Feb 8, 2021
Construction employment stalls in January with unemployment rate of 9.4%
New measures threaten to undermine recovery.

Market Data | Feb 4, 2021
Construction employment declined in 2020 in majority of metro areas
Houston-The Woodlands-Sugar Land and Brockton-Bridgewater-Easton, Mass. have worst 2020 losses, while Indianapolis-Carmel-Anderson, Ind. and Walla Walla, Wash. register largest gains in industry jobs.

Market Data | Feb 3, 2021
Construction spending diverges in December with slump in private nonresidential sector, mixed public work, and boom in homebuilding
Demand for nonresidential construction and public works will decline amid ongoing pandemic concerns.

Market Data | Feb 1, 2021
The New York City market is back on top and leads the U.S. hotel construction pipeline
New York City has the greatest number of projects under construction with 108 projects/19,439 rooms.

Market Data | Jan 29, 2021
Multifamily housing construction outlook soars in late 2020
Exceeds pre-COVID levels, reaching highest mark since 1st quarter 2018.

Market Data | Jan 29, 2021
The U.S. hotel construction pipeline stands at 5,216 projects/650,222 rooms at year-end 2020
At the end of Q4 ‘20, projects currently under construction stand at 1,487 projects/199,700 rooms.

Multifamily Housing | Jan 27, 2021
2021 multifamily housing outlook: Dallas, Miami, D.C., will lead apartment completions
In its latest outlook report for the multifamily rental market, Yardi Matrix outlined several reasons for hope for a solid recovery for the multifamily housing sector in 2021, especially during the second half of the year.

Market Data | Jan 26, 2021
Construction employment in December trails pre-pandemic levels in 34 states
Texas and Vermont have worst February-December losses while Virginia and Alabama add the most.

Market Data | Jan 19, 2021
Architecture Billings continue to lose ground
The pace of decline during December accelerated from November.


