


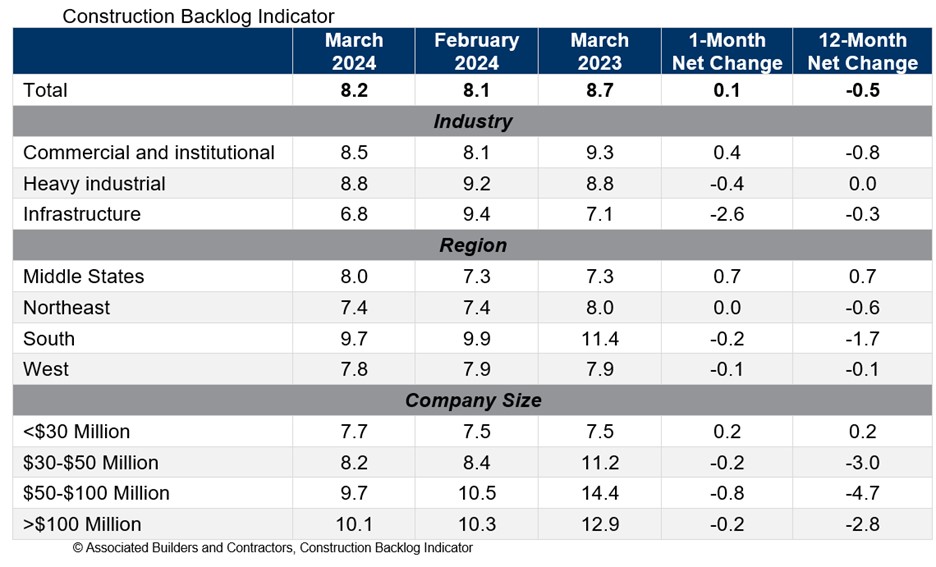
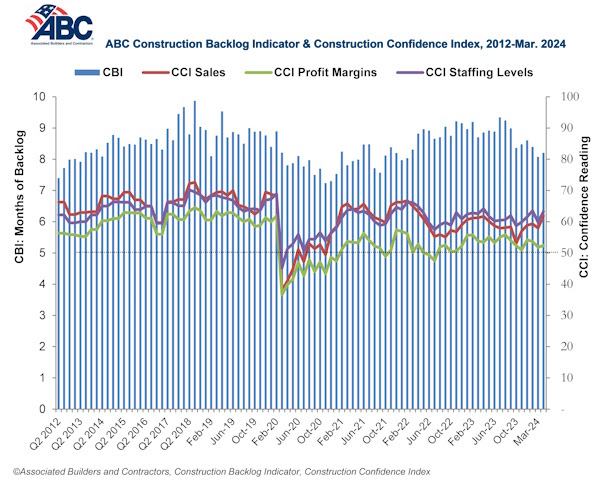
Associated Builders and Contractors reported today that its Construction Backlog Indicator increased to 8.2 months in March from 8.1 months in February, according to an ABC member survey conducted March 20 to April 3. The reading is down 0.5 months from March 2023.
View ABC’s Construction Backlog Indicator and Construction Confidence Index tables for March. View the full Construction Backlog Indicator and Construction Confidence Index data series.
Backlog is down over the past year for every region except for the Middle States, which now has the second largest backlog of any region. The South continues to have the largest backlog despite a large decline over the past year.
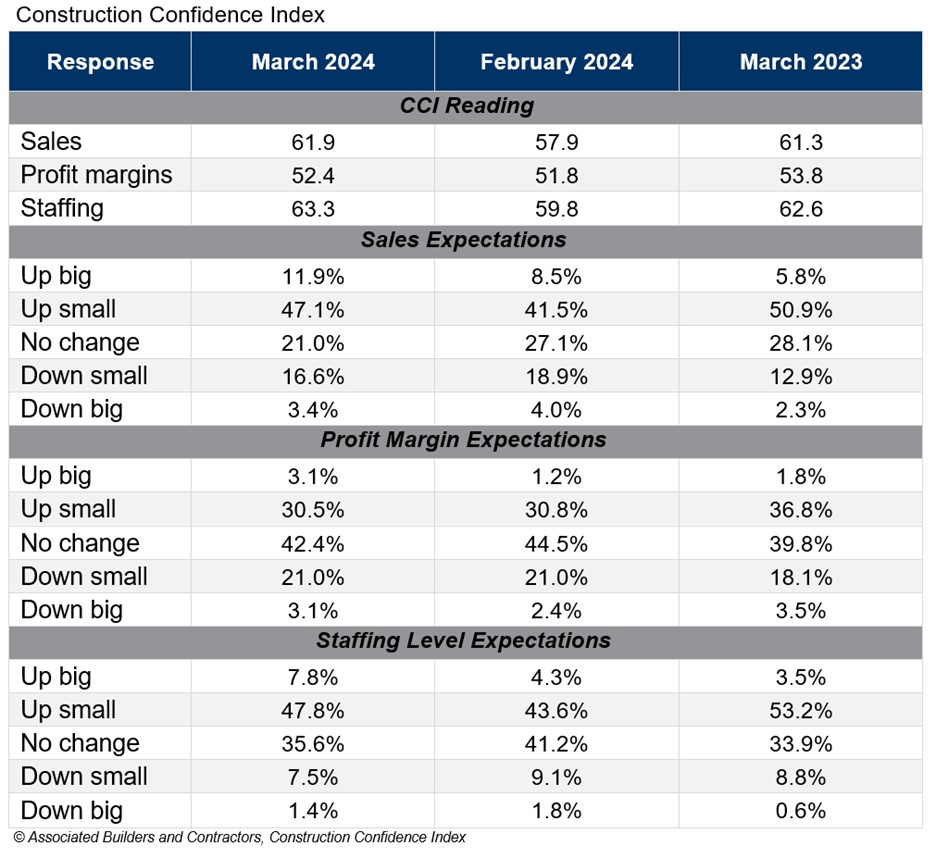
ABC’s Construction Confidence Index readings for sales, profit margins and staffing levels increased in March. All three readings remain above the threshold of 50, indicating expectations for growth over the next six months.
“Given headwinds such as high borrowing costs, emerging supply chain issues, project financing challenges and labor shortages, the persistent optimism among nonresidential construction contractors is astonishing,” said ABC Chief Economist Anirban Basu. “Last month, contractors reported rising backlog and greater conviction regarding likely growth in sales, employment and profit margins.
“While certain readings are below year-ago levels, there was broad-based improvement in March,” said Basu. “For instance, in the category of profit margins, 32% of those surveyed in February expected improvement over the next six months. That share rose to nearly 34% in March, with only 24% hinting at near-term margin compression. That indicates that though costs of delivering construction services continue to rise, contractors collectively enjoy enough pricing power to support stable to rising margins. If interest rates begin to decline during the summer as is widely expected, confidence is likely to climb further.”
Note: The reference months for the Construction Backlog Indicator and Construction Confidence Index data series were revised on May 12, 2020, to better reflect the survey period. CBI quantifies the previous month's work under contract based on the latest financials available, while CCI measures contractors' outlook for the next six months. View the methodology for both indicators.
Related Stories

Market Data | Nov 3, 2021
One-fifth of metro areas lost construction jobs between September 2020 and 2021
Beaumont-Port Arthur, Texas and Sacramento--Roseville--Arden-Arcade Calif. top lists of gainers.

Market Data | Nov 2, 2021
Construction spending slumps in September
A drop in residential work projects adds to ongoing downturn in private and public nonresidential.

Hotel Facilities | Oct 28, 2021
Marriott leads with the largest U.S. hotel construction pipeline at Q3 2021 close
In the third quarter alone, Marriott opened 60 new hotels/7,882 rooms accounting for 30% of all new hotel rooms that opened in the U.S.

Hotel Facilities | Oct 28, 2021
At the end of Q3 2021, Dallas tops the U.S. hotel construction pipeline
The top 25 U.S. markets account for 33% of all pipeline projects and 37% of all rooms in the U.S. hotel construction pipeline.

Market Data | Oct 27, 2021
Only 14 states and D.C. added construction jobs since the pandemic began
Supply problems, lack of infrastructure bill undermine recovery.

Market Data | Oct 26, 2021
U.S. construction pipeline experiences highs and lows in the third quarter
Renovation and conversion pipeline activity remains steady at the end of Q3 ‘21, with conversion projects hitting a cyclical peak, and ending the quarter at 752 projects/79,024 rooms.

Market Data | Oct 19, 2021
Demand for design services continues to increase
The Architecture Billings Index (ABI) score for September was 56.6.

Market Data | Oct 14, 2021
Climate-related risk could be a major headwind for real estate investment
A new trends report from PwC and ULI picks Nashville as the top metro for CRE prospects.

Market Data | Oct 14, 2021
Prices for construction materials continue to outstrip bid prices over 12 months
Construction officials renew push for immediate removal of tariffs on key construction materials.

Market Data | Oct 11, 2021
No decline in construction costs in sight
Construction cost gains are occurring at a time when nonresidential construction spending was down by 9.5 percent for the 12 months through July 2021.


