

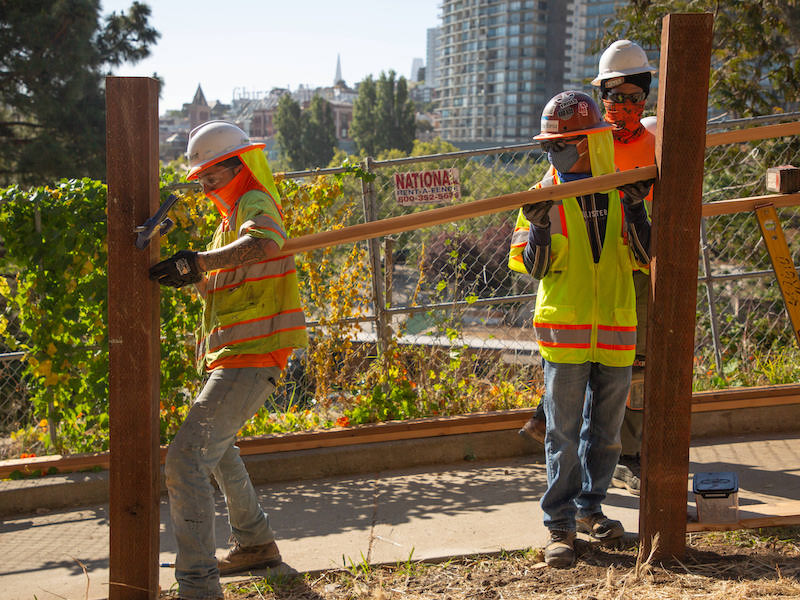
Construction employment in August remained below the levels reached before the pre-pandemic peak in February 2020 in 39 states, according to an analysis by the Associated General Contractors of America of government employment data released today. Association officials urged the House of Representatives to quickly pass the bipartisan infrastructure bill to avoid further cutbacks in construction activity and jobs.
“Construction employment slipped or stagnated from July to August in half the states as the delta variant of COVID-19 affected workers and caused some owners to delay projects,” said Ken Simonson, the association’s chief economist. “In addition, more than half of the respondents in our latest workforce survey reported experiencing projects that have been canceled, postponed, or scaled back.”
From February 2020—the month before the pandemic caused project shutdowns and cancellations—to last month, construction employment increased in only 11 states and the District of Columbia. Texas shed the most construction jobs over the period (-56,700 jobs or -7.3%), followed by New York (-50,700 jobs, -12.4%) and California (-34,900 jobs, -3.8%). Wyoming recorded the largest percentage loss (-16.6%, -3,800 jobs), followed by Louisiana (-14.4%, -19,700 jobs) and New York.
Utah added the most construction jobs since February 2020 (7,400 jobs, 6.5%), followed by North Carolina (4,500, 1.9%), Idaho (3,700 jobs, 6.7%), and South Carolina (3,700 jobs, 3.5%). The largest percentage gains were in South Dakota (7.1%, 1,700 jobs), followed by Idaho and Utah.
From July to August construction employment decreased in 22 states, increased in 25 states and D.C., and was unchanged in three states. The largest decline over the month occurred in Kansas, which lost 2,400 construction jobs or 3.7%. Georgia lost the second-most jobs (-2,300 jobs, -1.1%). The second-largest percentage decline since July, -2.1%, occurred in Alabama (-1,900 jobs) and Wyoming (-400 jobs).
Nevada added the most construction jobs between July and August (3,000 jobs, 3.3%), followed by New York (2,600 jobs, 0.7%) and Tennessee (2,600 jobs, 2.0%). New Hampshire had the largest percentage gain (4.4%, 1,200 jobs), followed by Nevada and Oklahoma (2.3%, 1,800 jobs).
Association officials warned that construction employment was being impacted in many parts of the country because of supply chain challenges and growing market uncertainty caused by the resurgent Delta variant. They said new federal infrastructure investments would provide a needed boost in demand and help put more people to work in construction careers.
“It is vital that Congress complete work on the bipartisan infrastructure bill before the end of month,” said Stephen E. Sandherr, the association’s chief executive officer. “Otherwise, funding will stop for much-needed highway and other public works projects and many more construction workers will lose their jobs.”
View state February 2020-August 2021 data and rankings, 1-month rankings. View AGC’s survey results.
Related Stories

Engineers | May 3, 2017
At first buoyed by Trump election, U.S. engineers now less optimistic about markets, new survey shows
The first quarter 2017 (Q1/17) of ACEC’s Engineering Business Index (EBI) dipped slightly (0.5 points) to 66.0.

Market Data | May 2, 2017
Nonresidential Spending loses steam after strong start to year
Spending in the segment totaled $708.6 billion on a seasonally adjusted, annualized basis.

Market Data | May 1, 2017
Nonresidential Fixed Investment surges despite sluggish economic in first quarter
Real gross domestic product (GDP) expanded 0.7 percent on a seasonally adjusted annualized rate during the first three months of the year.

Industry Research | Apr 28, 2017
A/E Industry lacks planning, but still spending large on hiring
The average 200-person A/E Firm is spending $200,000 on hiring, and not budgeting at all.

Market Data | Apr 19, 2017
Architecture Billings Index continues to strengthen
Balanced growth results in billings gains in all regions.

Market Data | Apr 13, 2017
2016’s top 10 states for commercial development
Three new states creep into the top 10 while first and second place remain unchanged.

Market Data | Apr 6, 2017
Architecture marketing: 5 tools to measure success
We’ve identified five architecture marketing tools that will help your firm evaluate if it’s on the track to more leads, higher growth, and broader brand visibility.

Market Data | Apr 3, 2017
Public nonresidential construction spending rebounds; overall spending unchanged in February
The segment totaled $701.9 billion on a seasonally adjusted annualized rate for the month, marking the seventh consecutive month in which nonresidential spending sat above the $700 billion threshold.

Market Data | Mar 29, 2017
Contractor confidence ends 2016 down but still in positive territory
Although all three diffusion indices in the survey fell by more than five points they remain well above the threshold of 50, which signals that construction activity will continue to be one of the few significant drivers of economic growth.

Market Data | Mar 24, 2017
These are the most and least innovative states for 2017
Connecticut, Virginia, and Maryland are all in the top 10 most innovative states, but none of them were able to claim the number one spot.


